Wall Street Memes (WSM) Price Stabilizes, a Minor Pullback Faced
Estimated Reading Time: 3 minutes
Don’t invest unless you’re prepared to lose all the money you invest. This is a high-risk investment and you are unlikely to be protected if something goes wrong. Take 2 minutes to learn more

Wall Street Memes Price Prediction – August 30
Currently, the WSM/USD trade shows a recurring trending setup, with the base asset tentatively moving along key levels to retest support as it seeks a potential all-time low while stabilizing amid a minor pullback.
The WSM/USD market is exhibiting a disciplined trending pattern, as the base asset navigates key support levels with measured momentum. Stabilizing amid a minor pullback, this setup hints at a controlled retest of lows, presenting a potential opportunity for cautious buyers to capitalize on emerging strength.
WSM/USD Market
Key Levels
Resistance levels: $0.0007, $0.0008, $0.0009
Support levels: $0.0005, $0.0004, $0.0003
WSM/USD – 4-hour Chart
The WSM/USD medium-term chart demonstrates that the base crypto economy stabilizes, as it faces a minor pullback.
The stochastic oscillators are in a resettling mode, backing the probability of getting back ideal bouncing strength at a considerable lower spot. The Bollinger Bands indicators have taken on a reshaped pattern between the trade lines of $0.0006 and $0.0005, affirming the main lower zones for long-term investors to strategically consider acquiring more positions ahead of massive potential bounce-offs.
Will the Underlying Market Hold Stability at Current Levels, or Slide Deeper amid the Present Pullback?
Despite minor pullback pressures, the WSM/USD market is stabilizing above support, with oscillators hinting at early rebound strength that could attract fresh buying momentum in coming sessions.
The trade’s stability remains tentative, as pullback pressures could extend if supports weaken, so traders should exercise caution and wait for clearer confirmation before committing to new positions.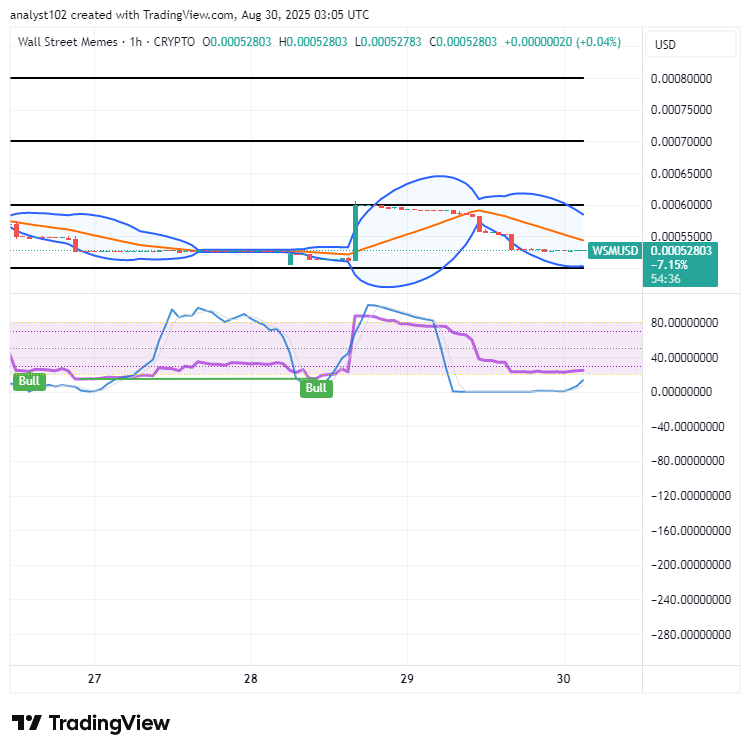
WSM/USD 1-hour chart
The 1-hour chart of the WSM/USD market shows that crypto’s price stabilizes as it faces a minor pullback.
The stochastic oscillators, as of this piece, have turned back into the oversold region, denoting a greater opportunity toward securing ideal buy entries and suggesting early rebound momentum. The Bollinger Bands indicators have widened to establish technically significant positioning between $0.0006 and $0.0005, highlighting key support and resistance zones for near-term trading activity.
Earn Up to 43% APY 🔥
(current at posting time)
Stake Here: [https://wallstmemes.com/en/dashboard](https://wallstmemes.com/en/dashboard)
Buy Here: [https://wallstmemes.com](https://wallstmemes.com)
🔥 Up To 43% APY Now Available 🔥
— Wall Street Memes (@wallstmemes) October 8, 2023
(at the time of posting)
Stake Now ➡️ https://t.co/X031FQo0bW Buy Now ➡️ https://t.co/6zkwWf1VRF pic.twitter.com/o9qrY1zJn8