Bitcoin (BTC/USD) Market Holds Strong Around $40,000
Estimated Reading Time: 3 minutes
Don’t invest unless you’re prepared to lose all the money you invest. This is a high-risk investment and you are unlikely to be protected if something goes wrong. Take 2 minutes to learn more
Bitcoin Price Prediction – July 29
There has been a signal that the BTC/USD market holds strong around the level at $40,000. The crypto trades around $40,605 at a percentage increase rate of 0.27.
BTC/USD Market
Key Levels:
Resistance levels: $42,500, $45,000, $47,500
Support levels: $37,500, $35,000, $32,500
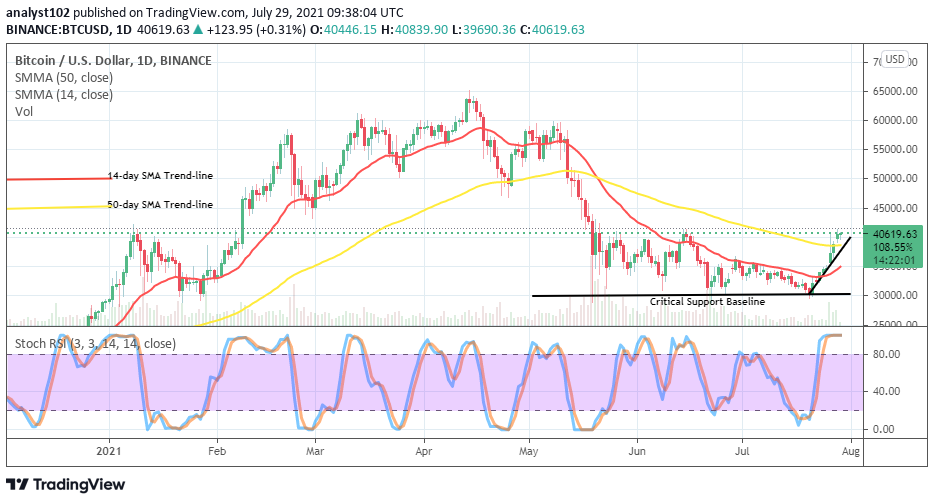
BTC/USD – Daily Chart
Today’s BTC/USD daily chart depicts that the crypto market holds strong around the line of $40,000. The bullish trend-line drawn, showing the north-path that the market keeps from the critical support baseline. The 50-day SMA indicator is above the 14-day SMA indicator. But, they both slightly bent toward the north to indicate that upward pressure is somewhat dominating the crypto’s trading pace currently. The Stochastic Oscillators are in the overbought with the two lines conjoined to signify a consolidation moving manner. That suggests that pressure to the side of the north has not yet lost out momentum.
As the BTC/USD market holds strong around $40,000, could there be a long-featuring price above it?
It might still take a while to have a sustainable price featuring above the level of $40,000 even as the BTC/USD market holds strong around it. In other words, there may at times that the crypto market falls lower and regain strength in no time to push upward above the point earlier mentioned. Between $40,000 and $45,000 are potentially going to witness variant trading situations if price consolidates at the level for a long time of session.
On the downside analysis, bears needed to be on the lookout for a sudden shoot-up of the price that eventually shows a sign of reversal before considering launching a sell order. A trading point around the immediate resistance at $42,500 is to witness rejection of a sudden upsurge that the market may make later on. Traders needed to be very cautious of their entry especially, those that are short-positioning takers.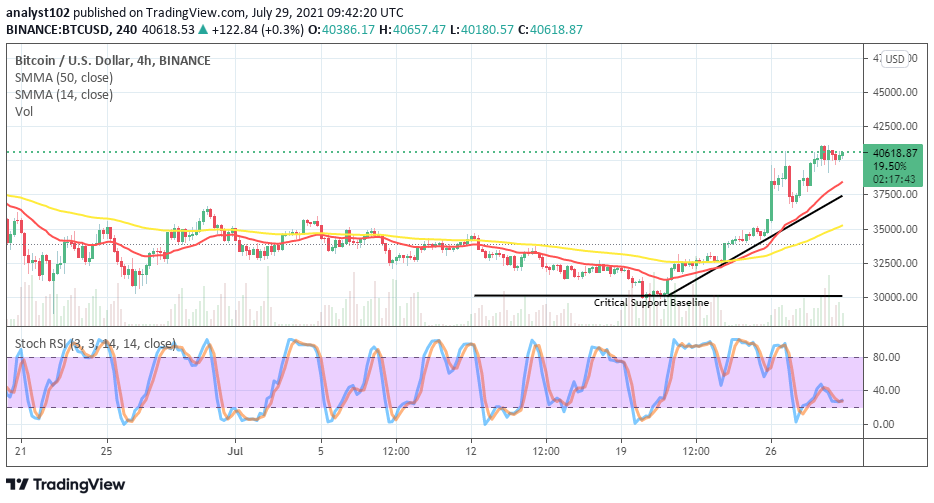
BTC/USD 4-hour Chart
The BTC/USD medium-term chart also depicts that the crypto market holds strong at a higher level of $40,000. The 14-day SMA indicator is above the 50-day SMA indicator as the bullish trend-line drew in a supportive manner beneath the smaller SMA. The indicators point toward the north to signify that the market has to extend been dominated by upward pressures. The Stochastic Oscillators are seemingly moving in a consolidation manner around the oversold region and the range 40. The pressure to the up still requires some time to recess around that trade capacity for a while.
Note: Cryptosignals.org is not a financial advisor. Do your research before investing your funds in any financial asset or presented product or event. We are not responsible for your investing results.
You can purchase crypto coins here. Buy Tokens