Compound (COMPUSD) Shows Reversal Signs at Market Discount Levels
Estimated Reading Time: 2 minutes
Don’t invest unless you’re prepared to lose all the money you invest. This is a high-risk investment and you are unlikely to be protected if something goes wrong. Take 2 minutes to learn more
COMPUSD Key Levels
Demand Levels: $95.00, $330.00, $690.00
Supply Levels: $265.00, $570.00, $875.00
COMPUSD Market Analysis
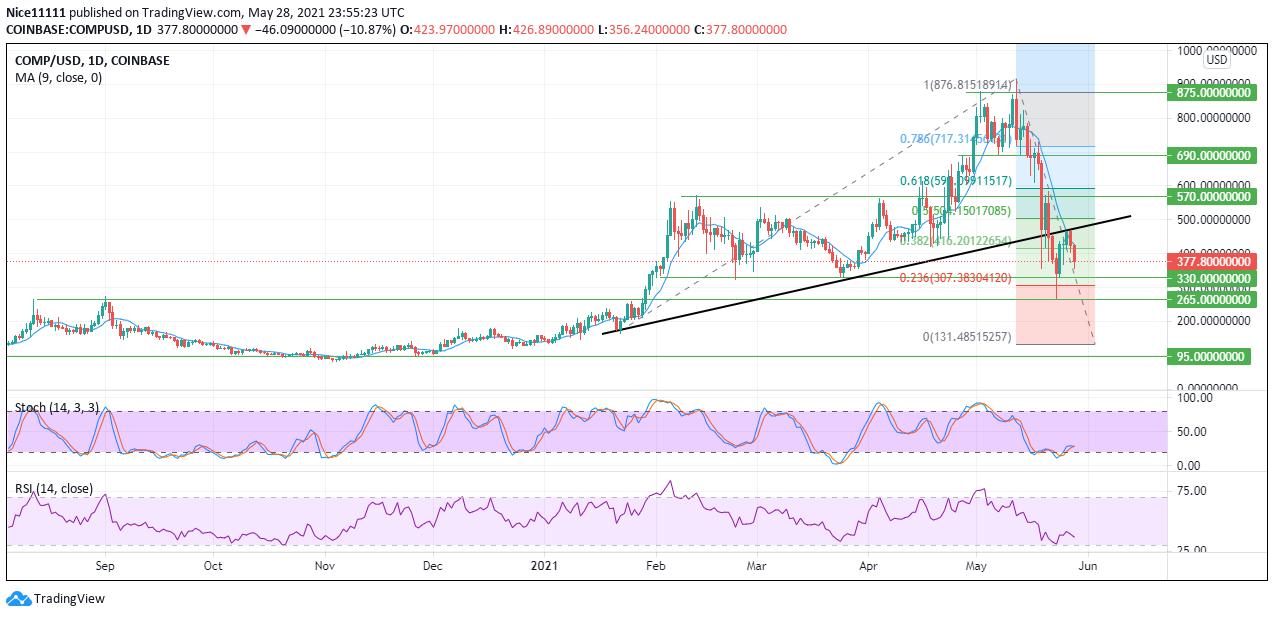
Compound formed a double top in the market to initiate a reversal in the market after reaching a high at $915.00 on the 13th of May this year. The neckline of the double top was broken on the 16th of May with a bearish spinning top candle. A huge sell-off is seen in the market afterward. The price moved from a premium level into discount levels. Compound plunged into discount areas below 0.236 on the Fibonacci. A long wick was formed showing the coin’s rejection from the previous resistance zone at $265.00.

COMPUSD Market Expectation

The Market is seen to have traded upwards after the rejection. The Relative Strength Index (RSI), as well as the Moving Average (MA), shows the market’s bearishness run. The Moving Average has dropped steeply to reflect price bearishness. The Stochastic indicator has its signal lines crossed, and slightly above the oversold region. This shows that price has a strong tendency to seek a higher price.
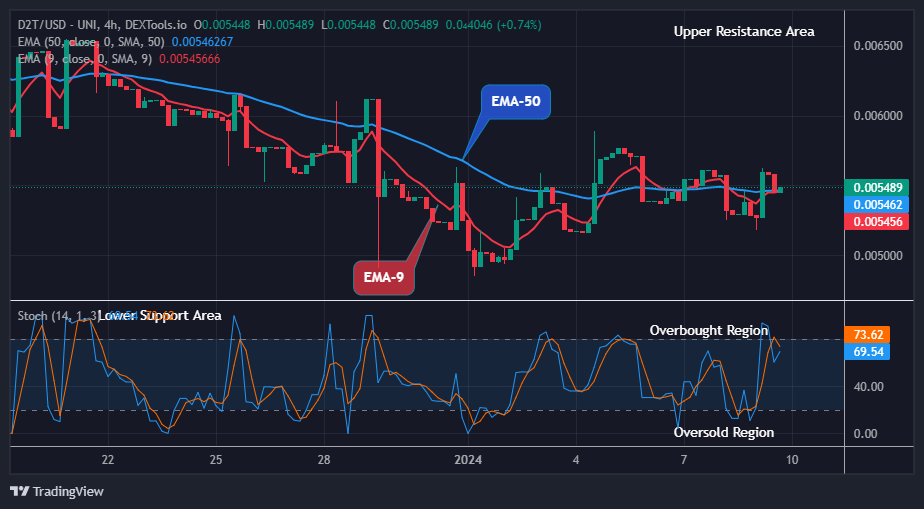
On the four-hour chart, the price is seen to battle the uptrend line which acts as a resistance. The Stochastic suggests higher prices as its signal lines are slightly above the oversold region. The Stochastic on the daily chart agrees with the four-hour chart for a buy in the market.
The Moving Average still reflects the fall in price. The Relative Strength Index indicator has its signal line currently below the equilibrium at 50 which is also a reflection of the bearishness of the market.
The market would likely break higher through the uptrend and seek for the next resistance at $570.00.
Note: new.cryptosignals.org is not a financial advisor. Do your research before investing your funds in any financial asset or presented product or event. We are not responsible for your investing results.