Ethereum (ETH) Consolidates Above $2,000 Support, May Resume Upward Move
Estimated Reading Time: 2 minutes
Don’t invest unless you’re prepared to lose all the money you invest. This is a high-risk investment and you are unlikely to be protected if something goes wrong. Take 2 minutes to learn more

Ethereum Price Long-Term Analysis: Bullish
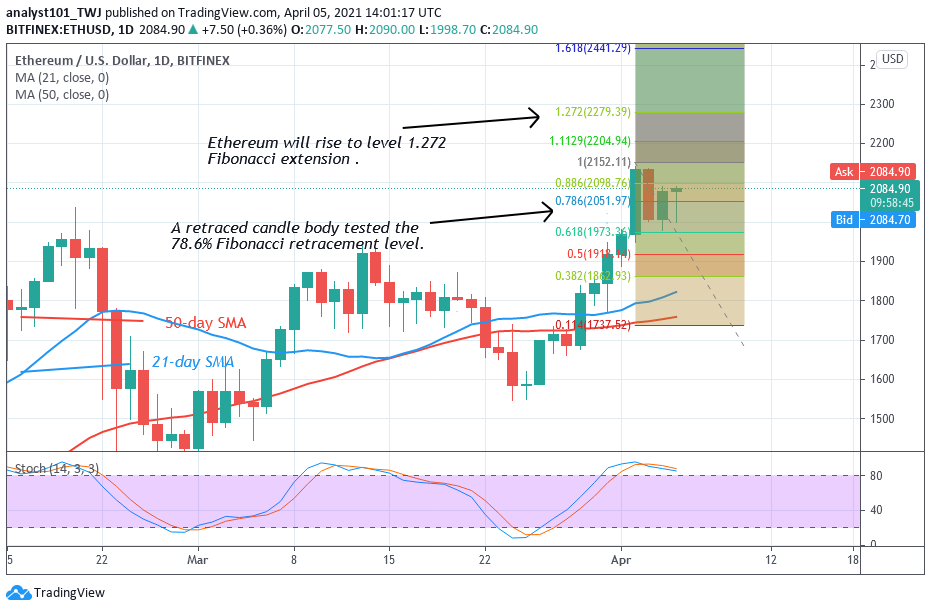
On the daily chart, the biggest altcoin rallied to the high of $2,142 but was resisted. Ether’s price is now fluctuating below the recent high. It is fluctuating between levels $2,000 and $2,150. Ether will rally to $2,500 if the bulls break the recent high. On April 3, a retraced candle body tested the 78.6% Fibonacci retracement level. It indicates that the market will rise to level 1.272 Fibonacci extensions or the high of $2,279.39.
Technical indicators:
Major Resistance Levels – $2, 500, $2,700, $2,900
Major Support Levels – $1.500, $1, 300, $1,100
Ethereum Indicator Analysis
The biggest altcoin is above the 80% range of the daily stochastic. It indicates that the market is in the overbought region. However, in a trending market, the overbought condition may not hold. The crypto’s price is above the SMAs which indicates a price of the coin.
What Is the Next Direction for Ethereum?
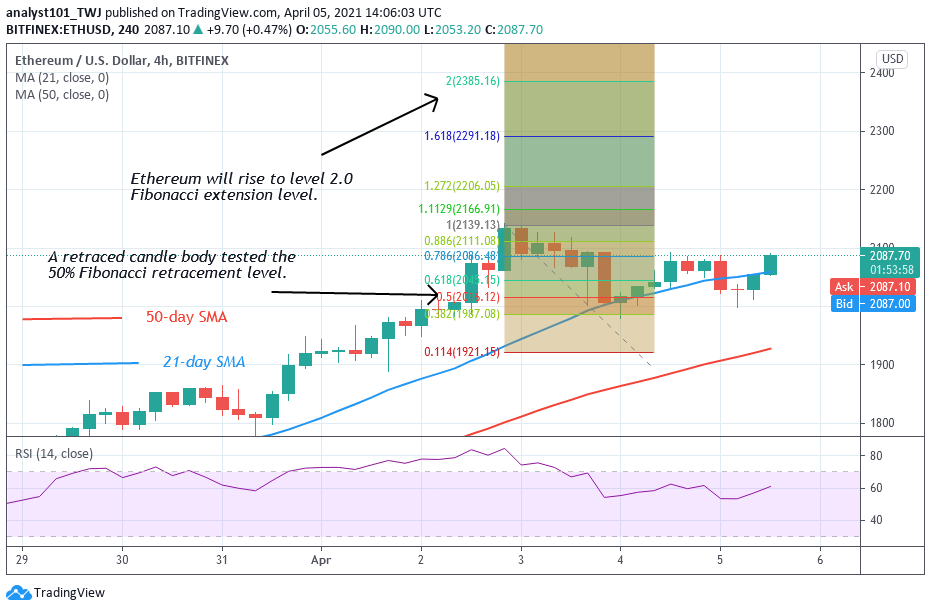
Ether price is likely to rise as the crypto is above the moving averages. On the 4 –hour chart, ETH is in a sideways trend after rejection from the recent high. On April 5, a retraced candle body tested the 50% Fibonacci retracement level. This retracement implies that Ether will rise to level 2.0 Fibonacci extensions or the high of $2,200.79.
Note: Cryptosignals.org is not a financial advisor. Do your research before investing your funds in any financial asset or presented product or event. We are not responsible for your investing results