Polygon (prev-MATIC) Price Prediction: POL/USDT Heads Toward $0.1700 Base Level
Estimated Reading Time: 2 minutes
Don’t invest unless you’re prepared to lose all the money you invest. This is a high-risk investment and you are unlikely to be protected if something goes wrong. Take 2 minutes to learn more

Polygon (prev-MATIC) Price Prediction (June 21, 2025)
The Polygon (prev-MATIC) market has been facing strong bearish sentiment. As a result, the pair has been oscillating around the $0.2000 price level. Currently, the market is heading south, and further price declines may occur.
POL/USDT Long-Term Trend: Bearish (Daily Chart)
Key Price Levels:
Resistance: $0.2000, $0.2500, $0.3000
Support: $0.1500, $0.1250, $0.1000
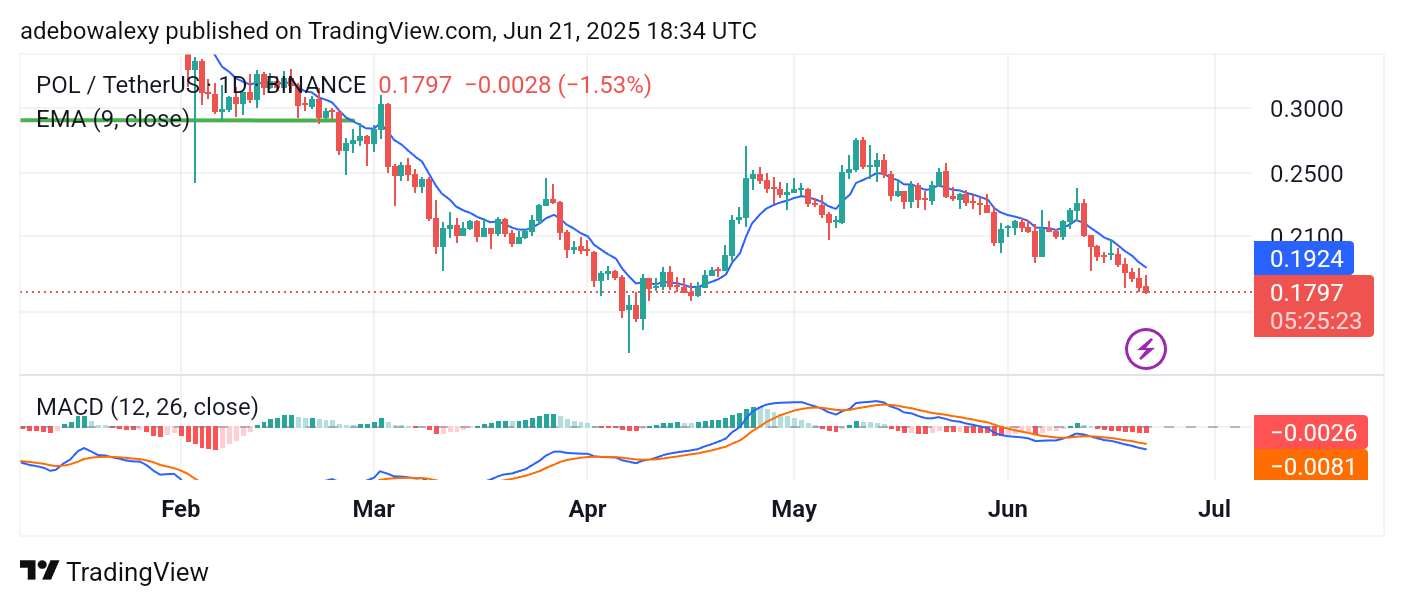
Price action in the Polygon (prev-MATIC) market has fallen below the 9-day Exponential Moving Average (EMA) line. In fact, price candles in this market have been bearish for the past nine sessions. As a result, the market continues to slide below the equilibrium level. The MACD lines have also been steadily trending downward below the equilibrium level. Similarly, the MACD histogram bars have remained consistently solid red over the recent sessions.
Polygon (prev-MATIC) Price Prediction: POL/USDT May Go Further South
All indicators in the Polygon (prev-MATIC) market point to ongoing bearish sentiment. As a result, the market remains under moderate downward pressure. Recent price candles have continued to appear bearish.
Furthermore, the fact that price action remains below the 9-day EMA line suggests that the bearish trend is likely to continue. Meanwhile, the MACD indicator lines remain below the equilibrium level, and the histogram bars are still red, reinforcing the dominance of bearish momentum.
Polygon (prev-MATIC) Price Prediction: POL/USDT Poised for Further Descent (4-Hour Chart)
Looking at the Polygon (prev-MATIC) market on the 4-hour chart, price activity continues to reflect bearish characteristics. A moderately sized price candle corresponding to the ongoing session has formed below the 9-day EMA line.

Likewise, the MACD lines have recently delivered a downward crossover below the equilibrium level, and their orientation remains southward. Consequently, traders can anticipate further price decline toward — and possibly through — the $0.1700 price level.