Solana Price Prediction: SOL/USDT Heads Towards $140 Base Level
Estimated Reading Time: 2 minutes
Don’t invest unless you’re prepared to lose all the money you invest. This is a high-risk investment and you are unlikely to be protected if something goes wrong. Take 2 minutes to learn more

Solana Price Prediction (June 20, 2025)
The Solana market has been on a general downward retracement ever since the token’s price action almost hit the resistance at the $170 price mark. Also, volatility seems to have dwindled considering the appearance of recent price candles. Nonetheless, let’s take a closer look at this market below.
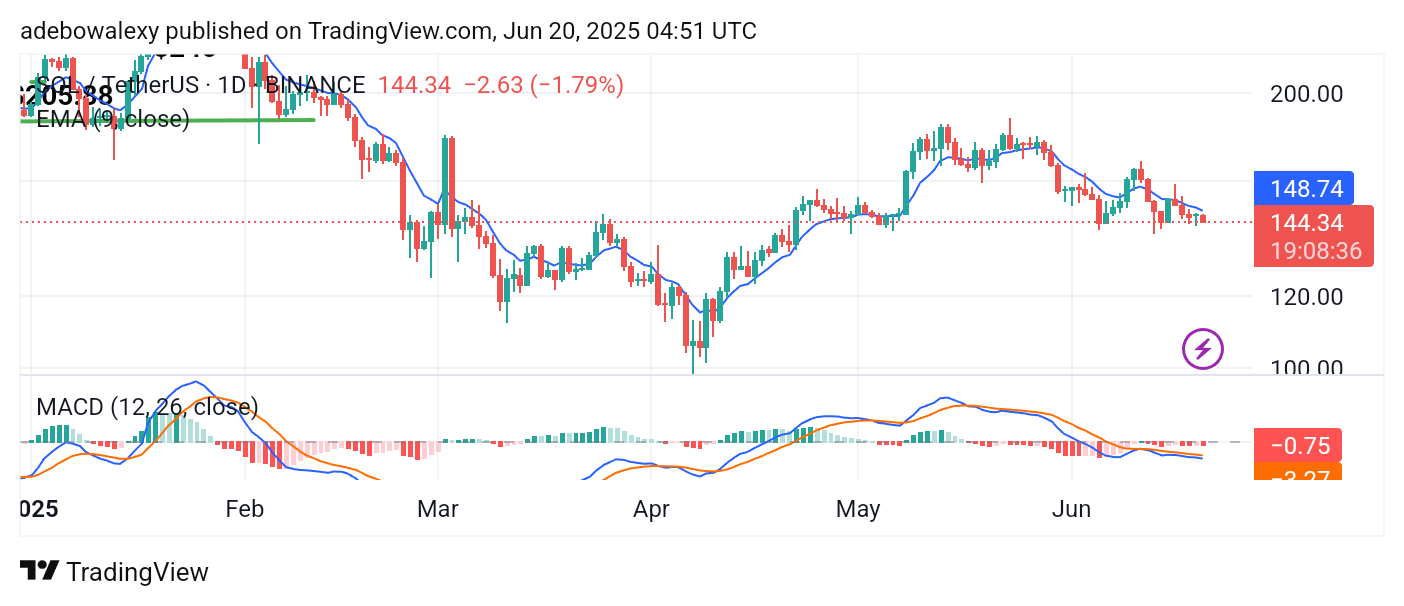
SOL/USDT Long-Term Trend: Bearish (Daily Chart)
Key Price Levels:
Resistance: $150, $160, $170
Support: $140, $120, $110
The last price candle on the Solana price chart is red. It has also appeared below the 9-day Exponential Moving Average (EMA) curve. At the same time, the Moving Average Convergence Divergence (MACD) indicator lines are now below the equilibrium level. In fact, this line is continuing a downward retracement. The bars of this indicator are very small but still appear below the equilibrium level.
Solana Price Prediction: SOL/USDT To Test Nearby Baseline
Going by price movement, activity seems headed towards a nearby support level. The appearance of the last price candles on the Solana daily price chart indicates that downward forces are still in control.
Meanwhile, the mentioned price candles can be seen to have appeared below the 9-day EMA line. The MACD indicator lines are below the equilibrium level. What’s more, they are taking a downward trajectory. Consequently, this suggests that price action in this market has a bearish orientation and may proceed lower subsequently.
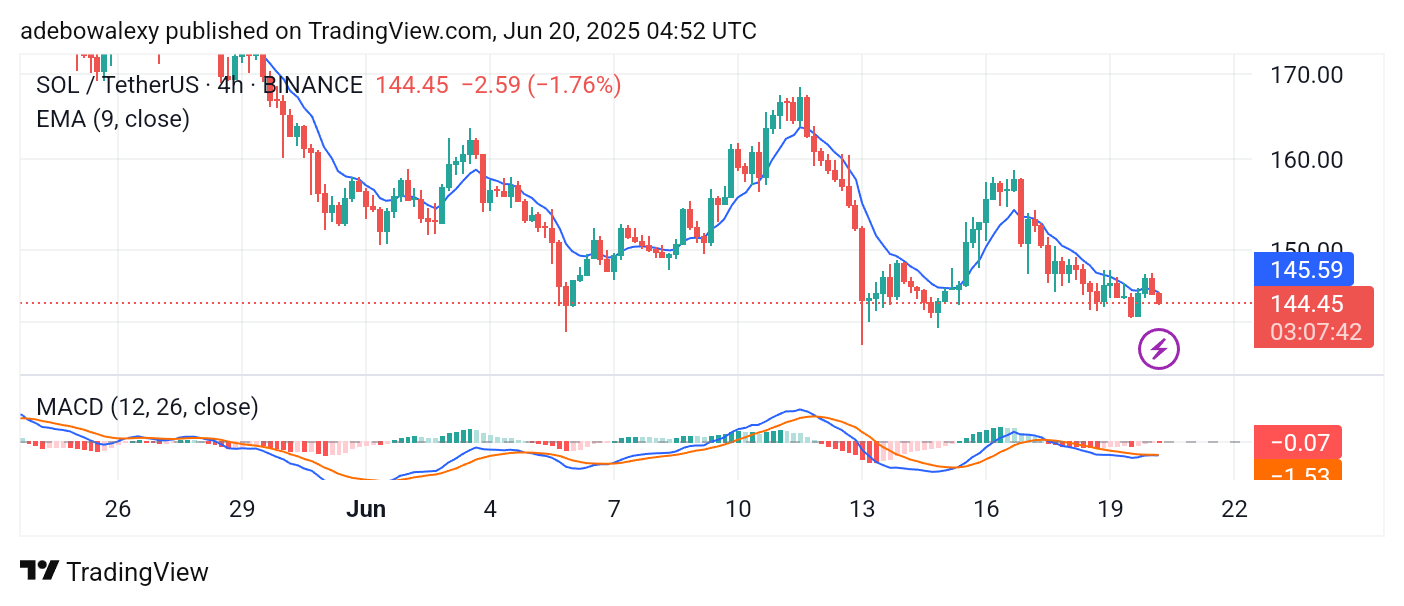
Solana Price Prediction: SOL/USDT Market Holds on to Current Trend (4-Hour Chart)
In the Solana 4-hour market, it appears that price action is staying consistent with bearish momentum. As it stands, the ongoing session has appeared bearish. Also, the corresponding price candles still stand below the 9-day EMA line.
This appears consistent with the analysis from the token’s daily chart. Additionally, the trajectory of the MACD lines remains the same as seen on the daily chart. Consequently, technical indicators suggest consistency, affirming that this market may hit the $140 price level.