Polkadot Advances as Bulls Test the $8.20 Barrier Level
Estimated Reading Time: 2 minutes
Don’t invest unless you’re prepared to lose all the money you invest. This is a high-risk investment and you are unlikely to be protected if something goes wrong. Take 2 minutes to learn more

Polkadot (DOT) Long-Term Analysis: Bullish
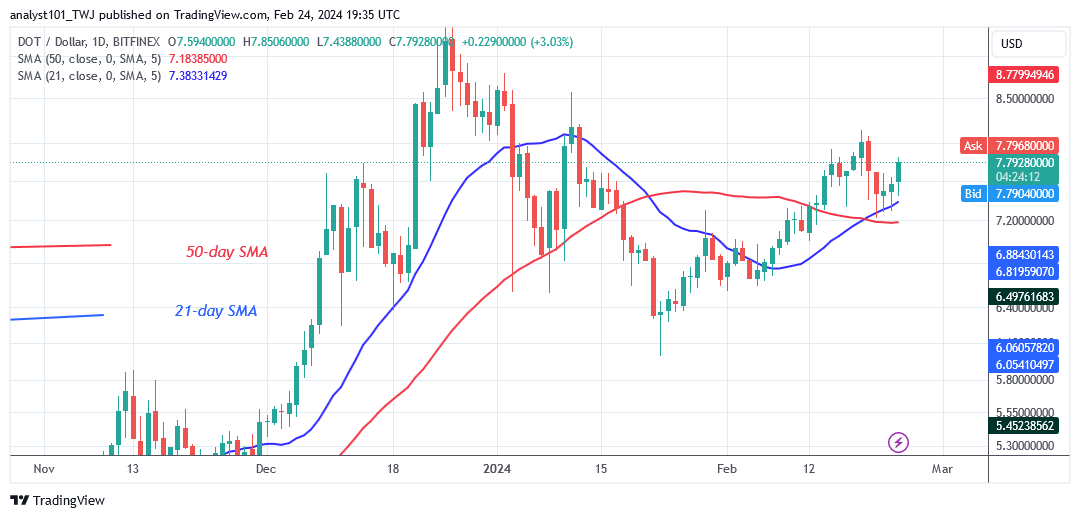
Polkadot’s (DOT) price is above the moving average lines as bulls test the $8.20 barrier level. Since January 11, upward advances have been limited to the $8.20 high. Today, the altcoin is rising, reaching a high of $7.80. On the upside, if the bulls break above the $8.20 resistance level, the altcoin will advance and revisit its prior highs of $8.60 and $9.40.
If buyers do not break through the barrier at $8.20, the altcoin will be forced to trade sideways. The DOT price will trade above the moving average lines but below the resistance at $8.20. The altcoin is currently heading upward, approaching the $8.20 barrier level.
Technical indicators:
Major Resistance Levels – $10, $12, $14
Major Support Levels – $8, $6, $4
Polkadot (DOT) Indicator Analysis
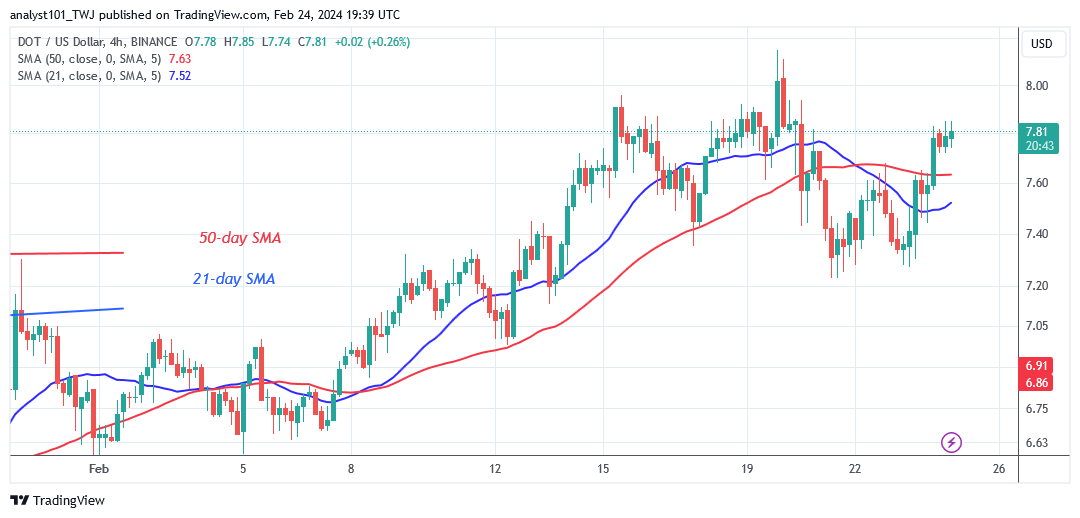
Following the recent dip, DOT price bars are rising above the moving average lines. On February 19, 2024, the altcoin achieved a bullish crossover, with the 21-day SMA crossing above the 50-day SMA. Traders have the opportunity to initiate bullish orders as the altcoin rises above the moving average lines.
What Is the Next Direction for Polkadot (DOT)?
Polkadot has recovered bullish momentum, with price bars rising above the moving average lines as bulls test the $8.20 barrier level. The altcoin’s upward movement above the moving average lines looks doubtful, as it faces resistance at $8.20. If the bulls fail to break above the $8.20 barrier, the crypto signal will remain sideways. Meanwhile, positive momentum continues as the market reaches previous highs.
You can purchase Lucky Block here. Buy LBLOCK
Note: Cryptosignals.org is not a financial advisor. Do your research before investing your funds in any financial asset or presented product or event. We are not responsible for your investing results