BNB Price Faces Challenges as Bears Move to Stop Uptrend
Estimated Reading Time: 4 minutes
Don’t invest unless you’re prepared to lose all the money you invest. This is a high-risk investment and you are unlikely to be protected if something goes wrong. Take 2 minutes to learn more
In the last 24 hours, the BNB price dipped to $871, marking a 5.7% weekly decline. As it stands, the fears of a U.S. shutdown have triggered a broad crypto sell-off, leaving BNB price struggles alongside other crypto assets.
Technically, BNB is showing significant weakness and is operating below key moving averages, with the 7-day Relative Strength Index (RSI) standing below 20. Though this market position often precedes a bounce. Still, the market is gripped by extreme fear, even as some accumulation is noticed against further falls.
Currently, BNB trades at $871.42 with over 44.5k traded volumes at the beginning of the week.
Technical Indicators
Major Resistance Levels: $925.97, $1,000.00, and $1,150.00
Major Support Levels: $850.00, $802.90, and $701.61
BNB Price Stalled; Could Grayscale’s ETF Filling Be the $1,000 Catalyst?
In a post by @pepeisfriend on X, it was highlighted that the BNB price is consolidating near the $890 mark, maintaining a stable appearance despite underlying market activities. It was mentioned in the post that price action remains sideways, with the ecosystem experiencing significant internal momentum, which could push the price from its recent quiet phase.
Additionally, the analyst hopes to see a positive change as Grayscale files for a spot BNB ETF. The analyst is of the opinion that if the move is approved, the BNB price could assume its usual top position again.
BNB is moving sideways around the $890 level. On the surface it looks quiet, but underneath, things are far from “cold.”
The most notable development is that Grayscale has filed for a spot #BNB ETF. If this progresses smoothly, it could become a major institutional catalyst that… pic.twitter.com/nD1TTyljsL
— PEPE is friend (@pepeisfriend) January 26, 2026
Technical Analysis
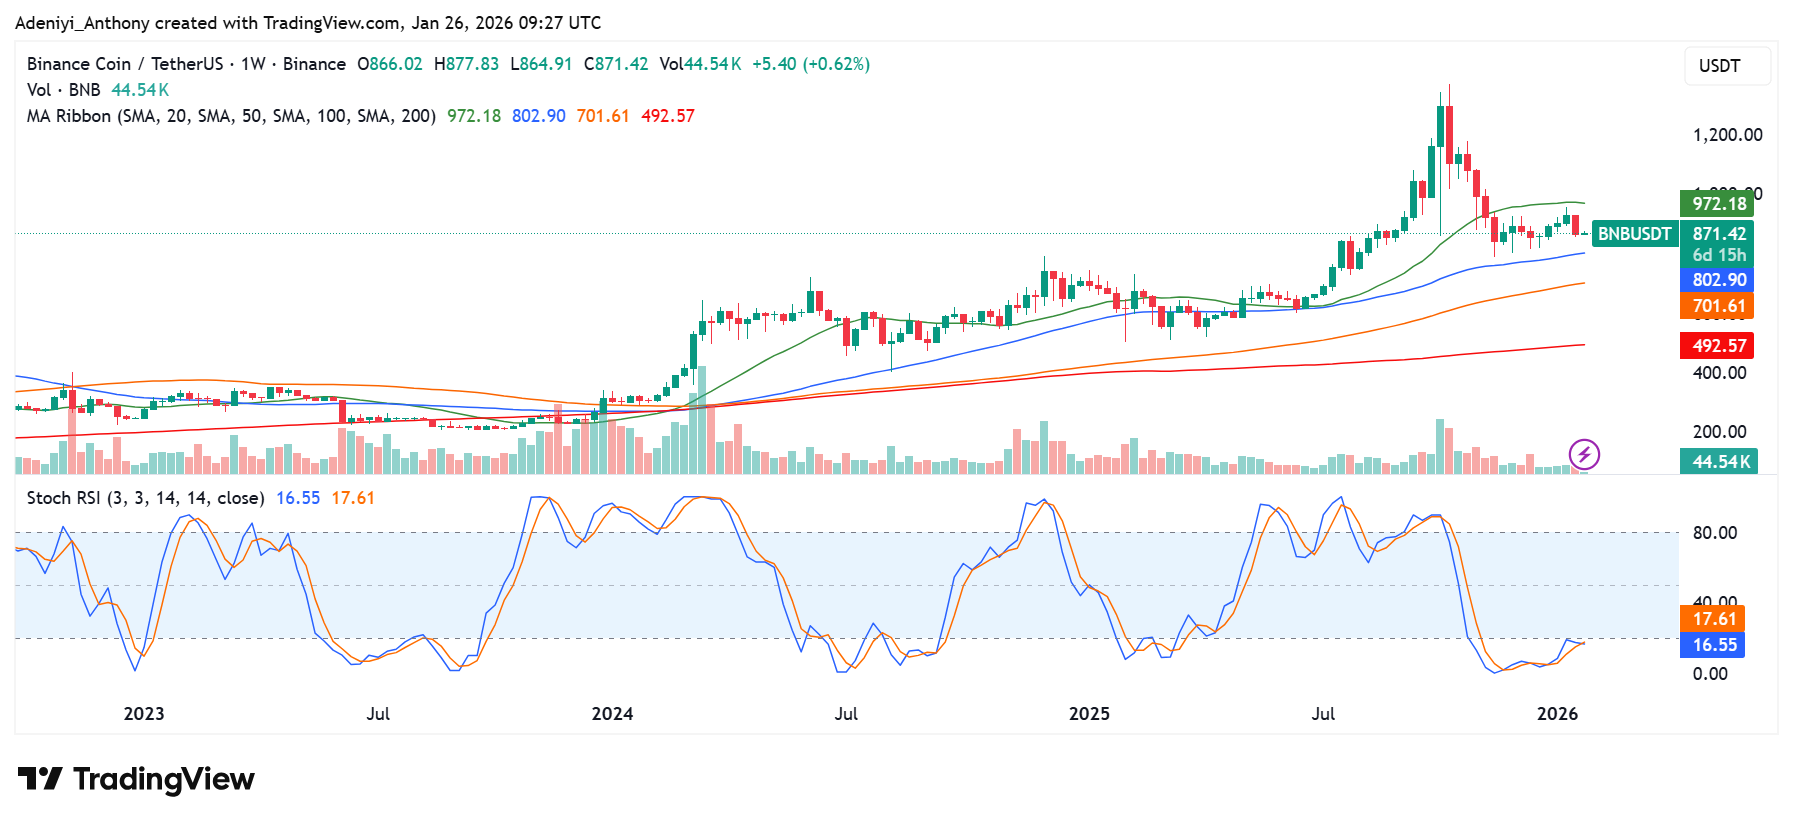
On the weekly chart, BNB against Tether is trading above its core moving averages. BNB against Tether appears to be extending upwards towards $972 despite a recent dip. However, it appears that the bears are already in the way of such progress, though the bullish structure is still intact, but it looks like $802.90 beckons. Meanwhile, activities on the Stochastic RSI show that momentum seems to be rising again, but the direction of the lines is not clear as the BNB price consolidates further.
To this end, the volume profile appears too low for an upward move as the price approached the $925.97 resistance. Meanwhile, the 20-week and 50-week moving averages are currently sloping upwards. However, the widening gap between the price and these averages suggests a potential mean reversion move could be on the horizon.
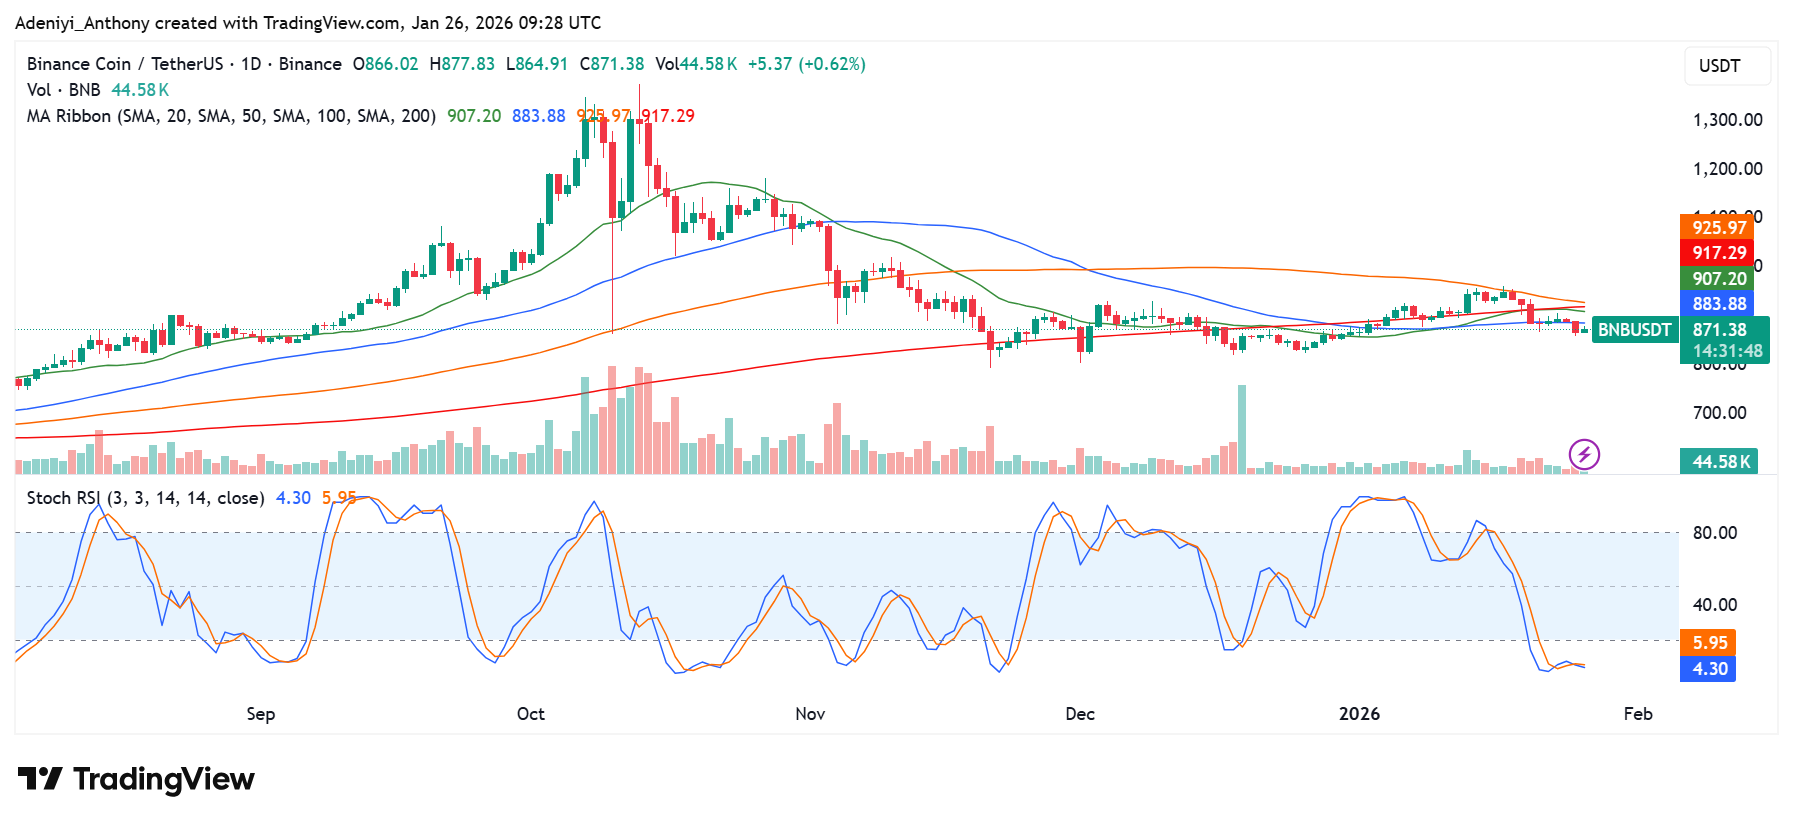
BNB/USDT Analysis: Stochastic RSI Reaches Oversold Extreme
On the daily timeframe, the BNB price appears to be operating below the cluster of the simple moving averages, testing the $871-$890 price range. However, the momentum oscillator suggests BNB/USDT is deeply oversold at 4.30. In technical terms, this often signals that selling momentum is reaching an exhaustion point.
To this end, while price remains pinned against the $871.38. If the daily candle fails to close above this mark, the technical outlook suggests a deeper slide toward $802.90. Conversely, a successful defense of this level, could lead to a retest of the $925.97 resistance.
You can purchase crypto coins here. Buy Crypto