Uniswap Price Prediction: UNI/USDT Challenges the $8.00 Mark Again
Estimated Reading Time: 3 minutes
Don’t invest unless you’re prepared to lose all the money you invest. This is a high-risk investment and you are unlikely to be protected if something goes wrong. Take 2 minutes to learn more

Uniswap Price Prediction (June 19, 2025)
Price activity in the Uniswap daily market has been steadily rising with modest momentum. Meanwhile, the ongoing session also suggests that price movement remains upward. This situation calls for further examination to identify profitable trading opportunities.
UNI/USDT Long-Term Trend: Bearish (Daily Chart)
Key Price Levels:
- Resistance: $8.00, $9.00, $10.00
- Support: $7.00, $6.00, $5.00
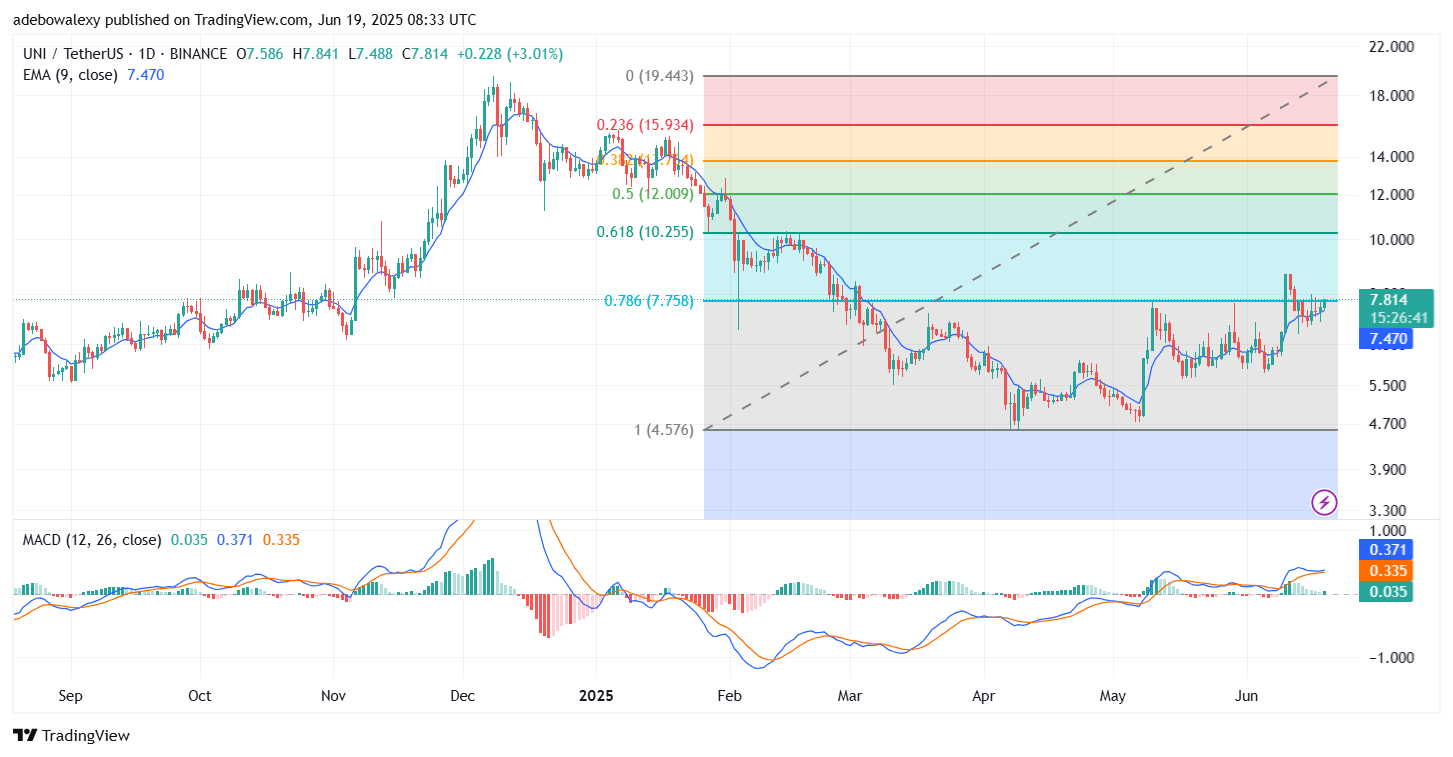
The latest price candle on the Uniswap daily chart appears above the 9-day Exponential Moving Average (EMA) line. The current session’s price candle also stands above the 9-day EMA and appears more prominent than previous candles. Consequently, the market is now facing the 78.60% Fibonacci Retracement level.
At the same time, the lines of the Moving Average Convergence Divergence (MACD) indicator remain above the equilibrium level and maintain an upward trajectory. The latest histogram bar on the MACD is green, indicating that upward momentum continues to strengthen.
Uniswap Price Prediction: UNI/USDT Prepares to Breach the $8.00 Level
The Uniswap market has been recording modest gains over recent sessions, keeping the price above key technical levels. The current session continues above the 9-day EMA, testing the 78.60% mark on the Fibonacci Retracement level.
Additionally, the appearance of the latest price candle suggests that increased buying activity may be occurring. The MACD lines remain above the equilibrium level, and their terminals appear to be diverging. Technically, this suggests that bullish momentum could continue to build as we move forward.
Uniswap Price Prediction: UNI/USDT Bulls Maintain an Impressive Stance (4-Hour Chart)
The Uniswap 4-hour chart aligns with the trend observed on the daily chart. The last three price candles on this chart are positioned above the 9-day EMA as well. Notably, the most recent price candle lacks both upper and lower shadows, implying that bullish forces are prevailing—especially as the candle is green.
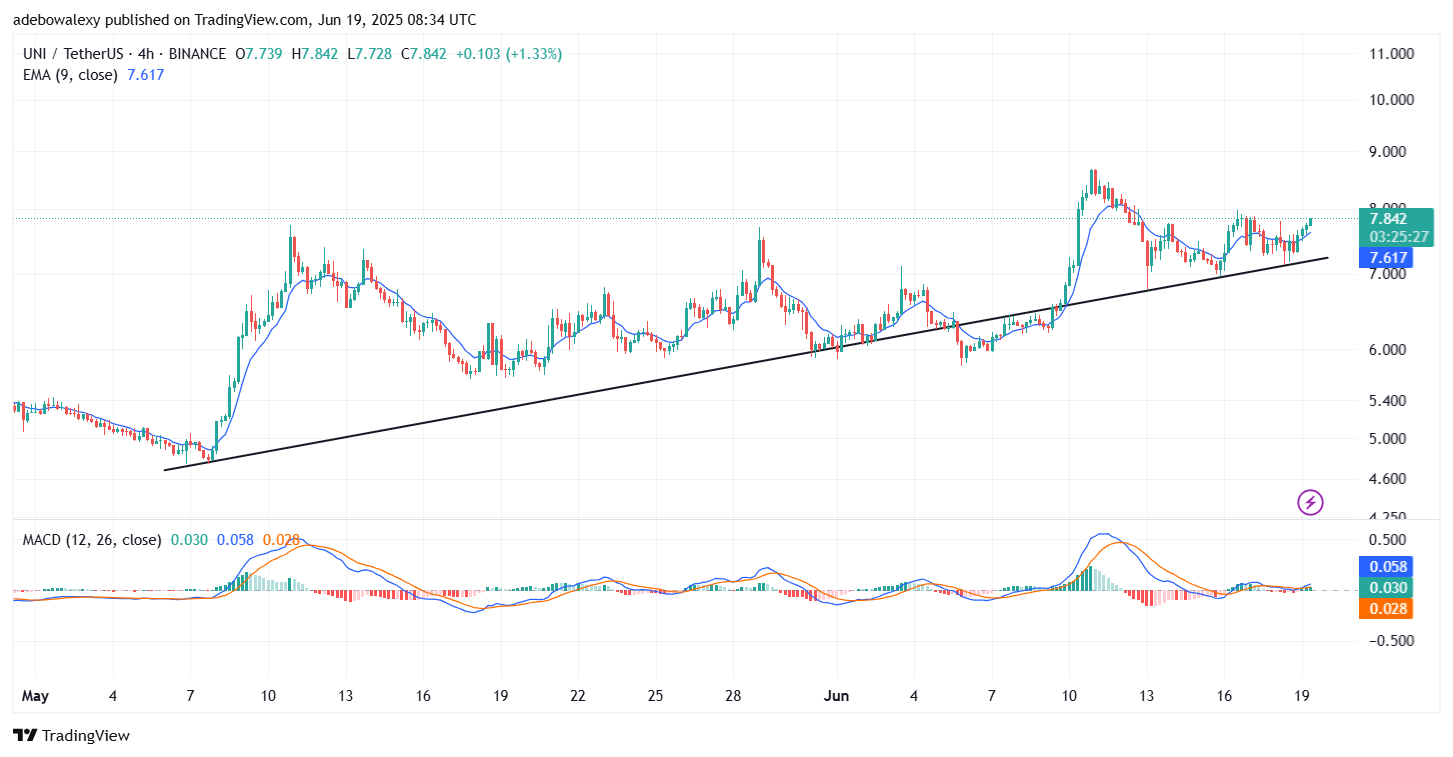
Meanwhile, the MACD line remains above the equilibrium level and continues on a slight upward trajectory. The histogram bars also appear above the equilibrium level. As a result, traders may expect price action to push through the $8.00 resistance level.