Chainlink (LINK/USDT) Faces Short-Term Resistance Amidst a Weak Recovery
Estimated Reading Time: 3 minutes
Don’t invest unless you’re prepared to lose all the money you invest. This is a high-risk investment and you are unlikely to be protected if something goes wrong. Take 2 minutes to learn more

The market for ChainLink against Tether over the last 24 hours has risen 1.14%, operating around $12.39. These statistics show that the pair is outperforming the broader crypto market’s 0.39% gain.
As it stands, it has been identified that accumulation worth $8.5 million by the whales in the last 48 hours and ETF stability are the prominent factors that have led to a mild rebound, as the prices seem settled above the $12 support level in recent times.
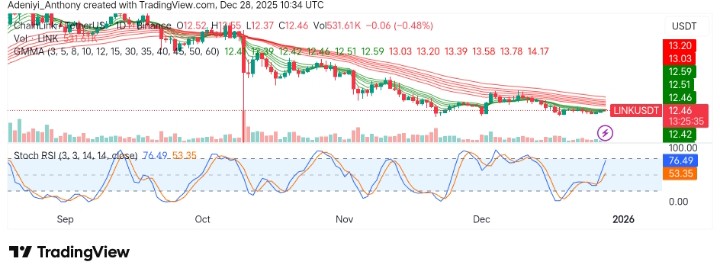
Currently, ChainLink trades at $12.46, with more than 531,000 volumes at the time of writing.
Technical Indicators
Major Resistance Levels: $12.59, $13.03, and $13.90
Major Support Levels: $12.42, $12.20, and $11.85
Technical Analysis
Technically, on the daily chart, ChainLink against Tether has been consolidating in a relatively narrow range, with a slight bearish trend. As it stands, the recent stochastic RSI readings point to overbought conditions, suggesting a potential pullback if the price cannot break above the immediate upper limit. However, the volume displays no convincing bullish or bearish strength as the price remains under the GMMA’s long-period EMAs.
As it stands, the price needs to reclaim the $12.59 resistance; otherwise, a short-term pullback may be recorded in the coming session.
ChainLink’s Update Today
Over the weeks, nothing has really happened in the ChainLink market as the token hangs upon support around $11.85 and $12.11. As it stands, the market still awaits evidence that the bulls are taking the lead, but the activities in the market remain calm with the hope that volatility will return late Sunday or Monday for the price to grind higher.
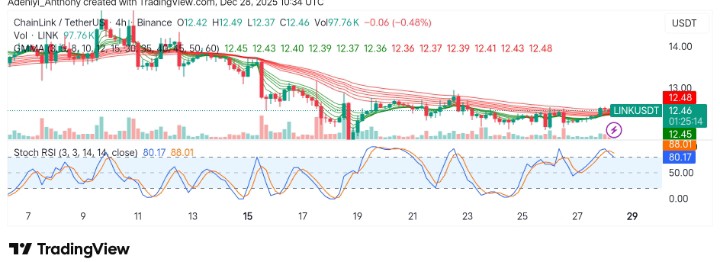
LINK/USDT Analysis: Price Sees a Short-Term Momentum Reversal
On the 4-hour chart, LINK/USDT is showing a slight upward move with the stochastic RSI reaching overbought levels. However, the lines of the indicator in recent times seem to be indicating a possible pause or correction soon, as the lines curl downward. The price has been hovering around $12.45–$12.48, but it is still battling resistance in the $12.48 range in this timeframe.
To this end, this range may act as a ceiling for the time being, as the volume and GMMA fail to indicate a change favorable to the bulls.
You can purchase crypto coins here. Buy Crypto