Polkadot Begins Its Ascent but Faces the Hurdle at $5.30
Estimated Reading Time: 2 minutes
Don’t invest unless you’re prepared to lose all the money you invest. This is a high-risk investment and you are unlikely to be protected if something goes wrong. Take 2 minutes to learn more

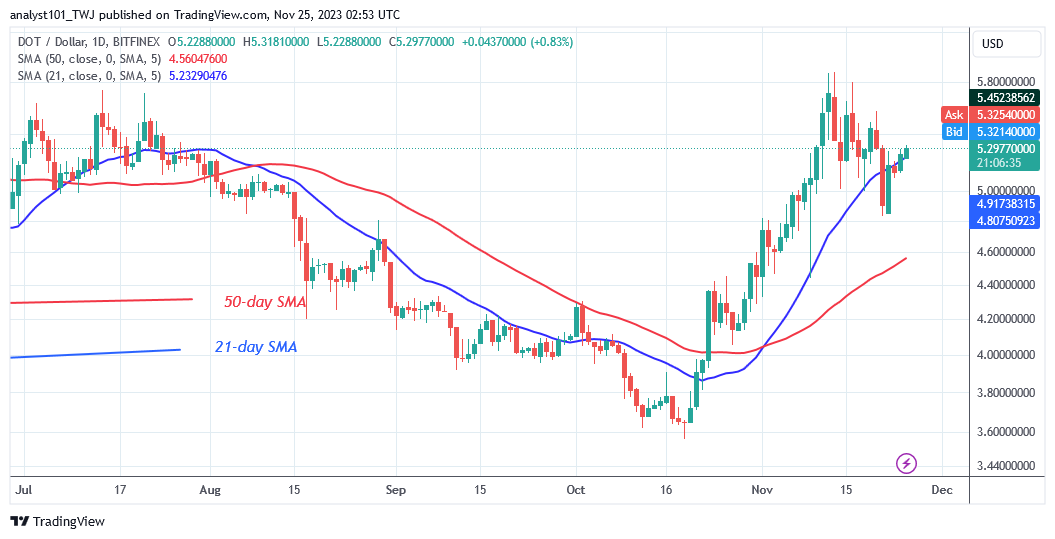
Polkadot (DOT) Long-Term Analysis: Bullish
Polkadot (DOT) slips below the 21-day SMA on November 21 but faces the hurdle at $5.30. Buyers are pushing the altcoin to the high of $5.80. In the previous uptrend, the crypto’s price retested the $5.80 high on four occasions but was repelled. The $5.80 resistance is the July 21 historical price level. The recent high has not been broken since July 21.
On the upside, the DOT/USD price will rise to $9 if the current resistance is breached. On the other hand, where the bulls fail to break the resistance level, the altcoin will decline and resume its sideways move between $5.00 and $5.80 price levels.
hnical indicators:
Major Resistance Levels – $10, $12, $14
Major Support Levels – $8, $6, $4
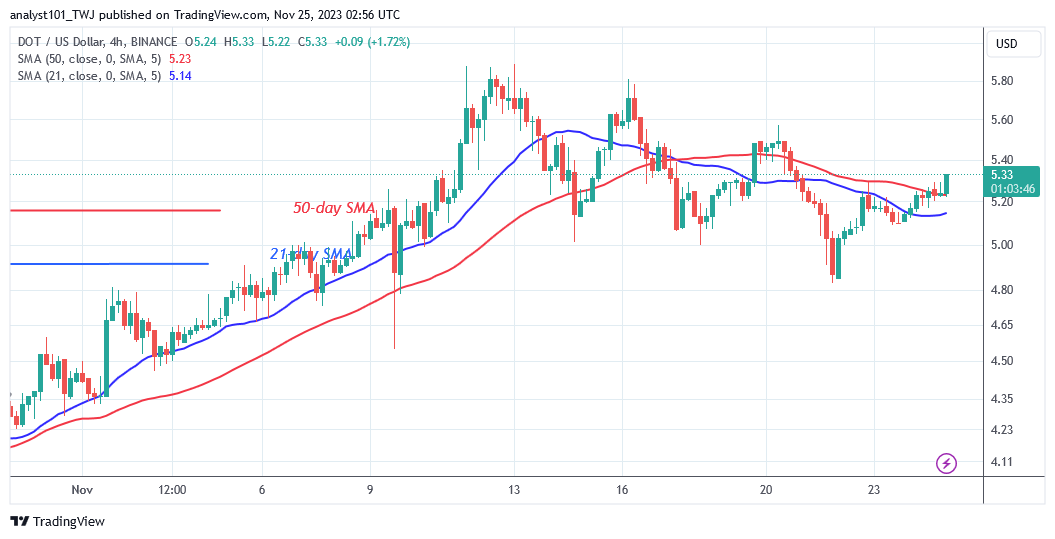
Polkadot (DOT) Indicator Analysis
The Polkadot price bars are somewhat above the moving average lines as they start to increase. The lower highs and lower lows pattern on the 4-hour chart has been broken, as the price bars remain above the moving average lines. The upward-sloping moving average lines represent the current trend.
What Is the Next Direction for Polkadot (DOT)?
The cryptocurrency is gaining as it re-enters the positive trend zone but faces the hurdle at $5.30. Since the end of the upswing on November 12, the altcoin has traded around the $5.00 to $5.80 range. If the bulls break through the resistance at $5.80, the second phase of the uptrend will begin. The DOT price has now reached a high of $5.30.
You can purchase Lucky Block here. Buy LBLOCK
Note: Cryptosignals.org is not a financial advisor. Do your research before investing your funds in any financial asset or presented product or event. We are not responsible for your investing results