ChainLink (LINK) Shows Sign of Potential Breakout While Consolidating Around $11.80
Estimated Reading Time: 3 minutes
Don’t invest unless you’re prepared to lose all the money you invest. This is a high-risk investment and you are unlikely to be protected if something goes wrong. Take 2 minutes to learn more

ChainLink Long-term Analysis: Bearish
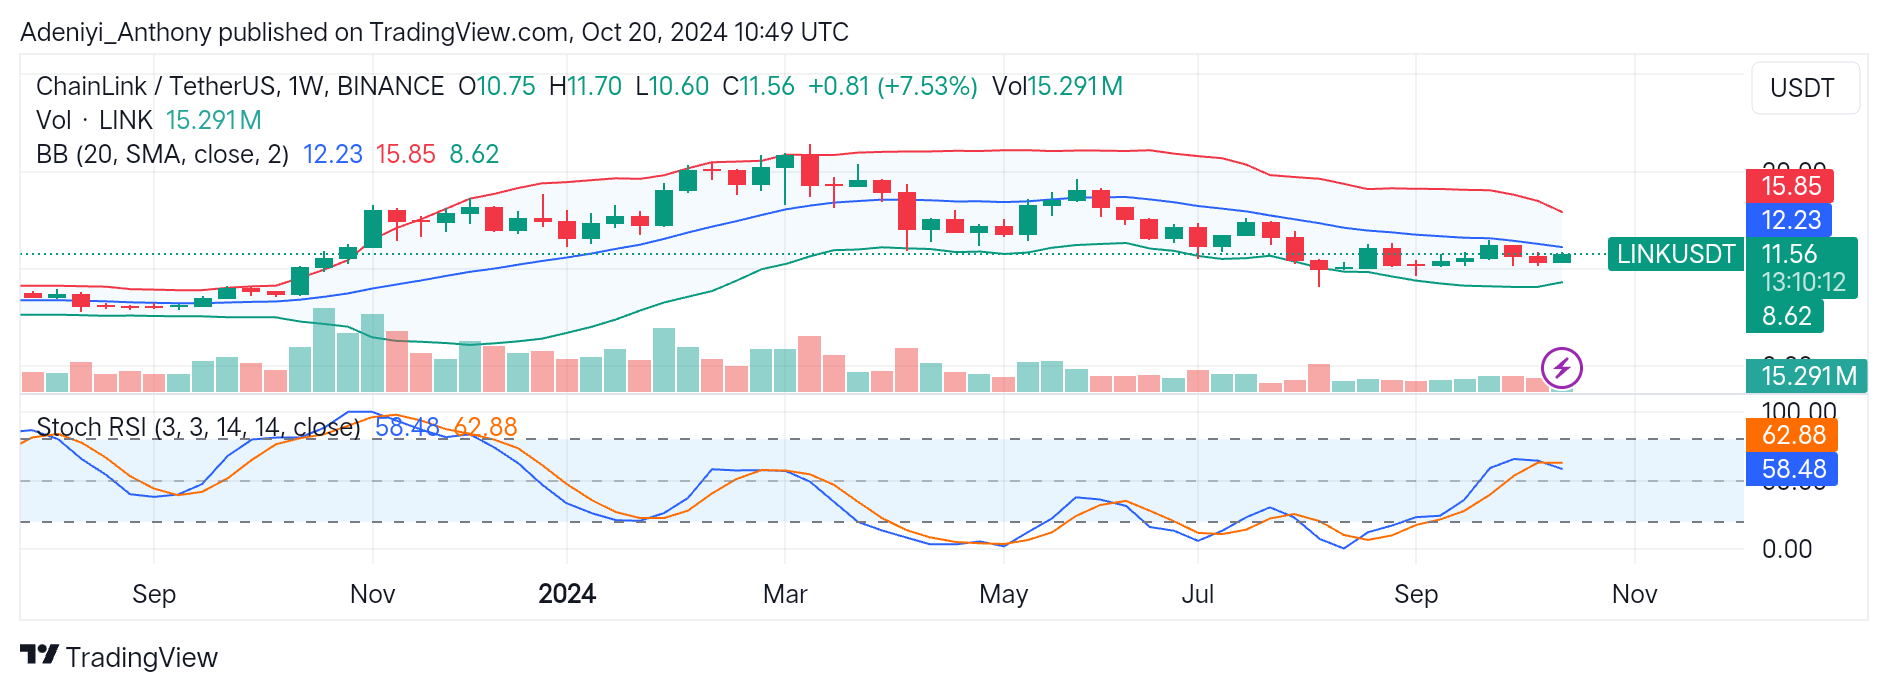
ChainLink (LINK) against the Tether this week has witnessed a price surge of about 7.53%, with the pair’s price aiming at $12.23. Prior to this time, LINK/USDT has been ranging between the lower segment of the Bollinger bands. However, the tightened bands signifies a potential breakout is close.
Generally, after the $22.60 high this year, LINK/USDT has been on a downtrend with a lot of rejection at major resistance levels. Presently, the recent attempt towards the middle Bollinger band shows that mild bullish momentum is building up.
For confirmation of the current trend, the price needs to break above the $12.23 level; otherwise, a reversal to the south is possible if the lines of the Stochastic oscillator take a downturn and the price hits below the lower band at $8.62.
With the current price of the coin at $11.56 and a trading volume of 15.291M, what is the next direction?
Technical Indicators
Major Resistance Levels: $12.23, $15.85, and $18.00
Major Support Levels: $11.00, $8.61, and $7.00
ChainLink Technical Analysis
Chainlink against the Tether operates near the $12.23 dynamic resistance level without a clear direction. However, the current contraction of the bands shows an impending directional breakout is on the horizon.
For confirmation of a bullish breakout and trend reversal to the upside, the price needs to break above the current resistance level. Conversely, a drop below the $8.61 level would indicate recent price action is a minor retracement; a direction to the south might resurface.
The Stochastic RSI below the chart operates between 50 and 60 levels, indicating the pair is close to the overbought region. If the line moves further upward into the overbought area, the pair’s price might hit a new high with a little retracement.
Presently, the lines’ horizontal movement indicates the LINK/USDT is ranging. However, if the lines cross below the 30-point level, the pair may see a continuation of the downtrend.
LINK/USDT Analysis: What is the Next Direction?
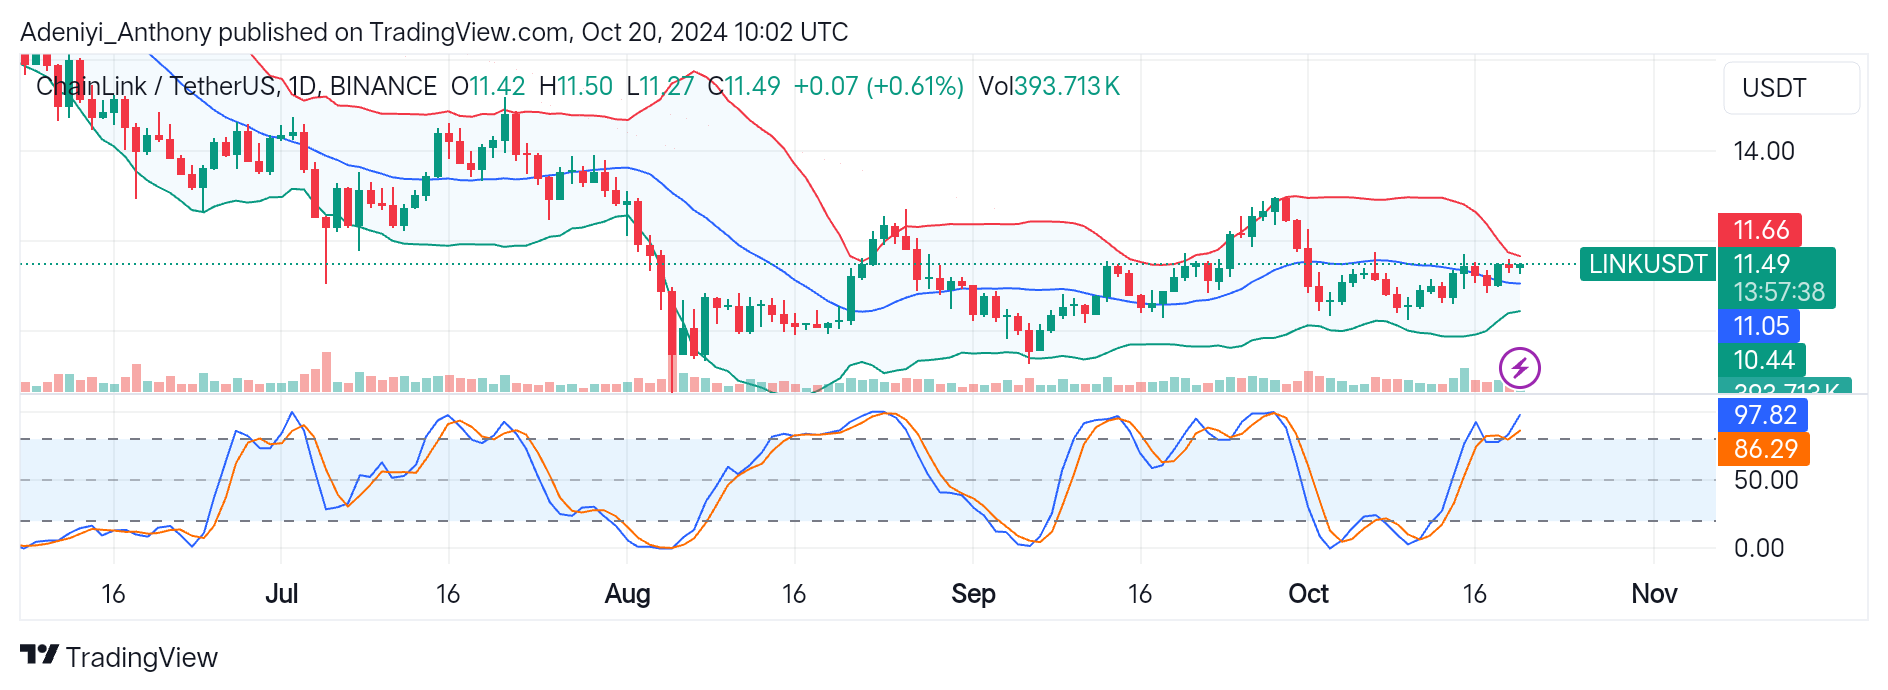
On the daily timeframe, LINK/USDT is around the mid-band with a slight uptick. The indicators on this chart suggest a big move is on the horizon, as the bands seem rather too close. On the other hand, the Stochastic RSI signals an overbought condition with the possibility of extending further into the zone.
For a breakout to the upside to be confirmed, the price needs to break above $11.66, with the possibility of a little pullback. Conversely, traders need to watch out for a crossover because if the price refuses to break above $11.66, it might revisit $11.05 even the $10.44 at the lower band.
You can purchase crypto coins here. Buy LBlock