Litecoin (LTC/USD) Market Appears, Getting Exhausted at $55
Estimated Reading Time: 3 minutes
Don’t invest unless you’re prepared to lose all the money you invest. This is a high-risk investment and you are unlikely to be protected if something goes wrong. Take 2 minutes to learn more

Free Crypto Signals Channel
Litecoin Price Prediction – October 5
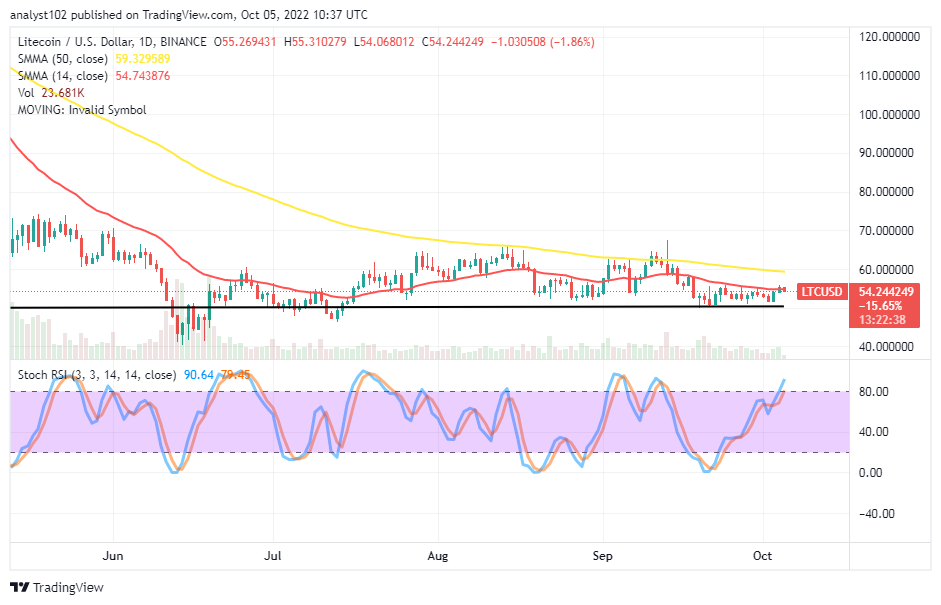
Recently, a chain of variant range-moving modes surfaced closely above the $50 support line. The situation has degenerated in the opposite direction, showcasing that the crypto market appears, getting exhausted at the value line. As of the time of writing, the price trades around $54.24 at an average percentage rate of 1.86 negative.
LTC/USD Market
Key Levels:
Resistance levels: $60, $65, $70
Support levels: $50, $45, $40
LTC/USD – Daily Chart
Today’s LTC/USD daily chart reveals the crypto market appears, getting exhausted at $55 after making a failed attempt to breach southward past the $50 support level. Some variant degrees of smaller-ups and smaller-downs have occurred in those points in the last several days. The 14-day SMA indicator is at $54.74, underneath the $59.34 value line of the 50-day SMA indicator. The Stochastic Oscillators have crossed northbound briefly into the overbought region as they maintain 79.45 and 90.64 range values.
Will the LTC/USD market break through some more resistance from its current trading point?
No strong indications have specified the possibility of the LTC/USD market breaking through some more resistances from its current trading point as the crypto market appears, getting exhausted at a high-trading level of around $55. In the wake of that analytics sentiment playing out accordingly, buyers will need to be cautious of going for a re-launch order for a while.
On the downside of the technical analysis, buying activities may be systemically hit a desirable resistance point closely around the resistance-trending area of the 50-day SMA before a selling order can execute. A smaller bearish candlestick tends to resurface around the trend line of the 14-day SMA. However, the capacity force to back up the downward-trending motion seems.
LTC/BTC Price Analysis
Litecoin has concurrently kept moving in range-bound zones at high spots. The cryptocurrency pair market appears; getting exhausted around the SMA trend lines in the range-bound zones. The 14-day SMA indicator is flatly close to the 50-day SMA indicator. The Stochastic Oscillators are in the oversold region, seemingly consolidating their movements at the pace of 16.51 and 15.39 range values to indicate the base crypto may still succumb to a debasing condition, pairing with its counter-trading crypto.
Note: Cryptosignals.org is not a financial advisor. Do your research before investing your funds in any financial asset or presented product or event. We are not responsible for your investing results.
You can purchase Lucky Block here. Buy LBLOCK