Litecoin (LTC/USD) Attempts Further Drawdown
Estimated Reading Time: 3 minutes
Don’t invest unless you’re prepared to lose all the money you invest. This is a high-risk investment and you are unlikely to be protected if something goes wrong. Take 2 minutes to learn more
Litecoin Price Prediction – June 8
There has appeared that the market operation between Litecoin and the US Dollar now attempts further drawdown as it has been fetched from most of the trading indicators. In the late activities, the crypto price maintains perfect range-bound trading zones. Price now trades around $156 at a percentage reduction rate of about -3.18.
LTC/USD Market
Key Levels:
Resistance levels: $200, $250, $300
Support levels: $130, $120, $110
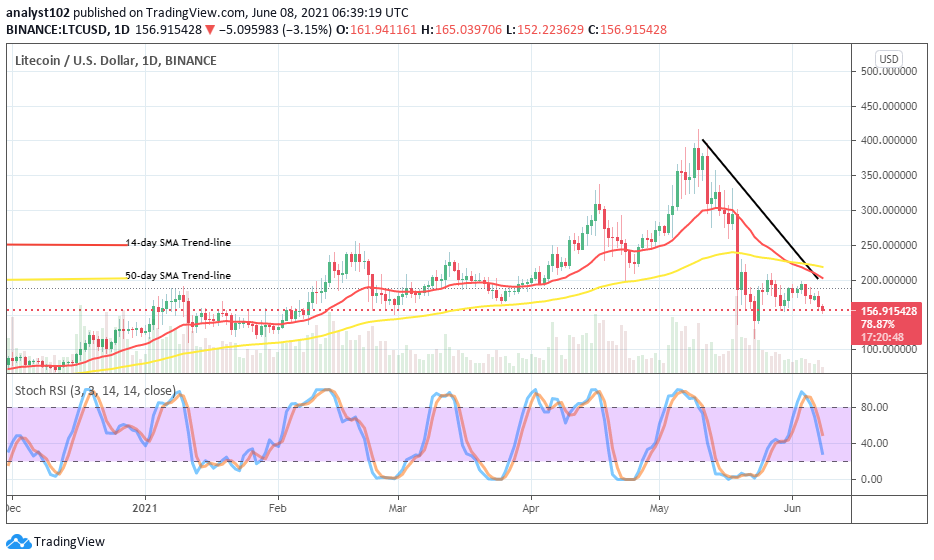
LTC/USD – Daily Chart
It is presently showcased on the LTC/USD daily chart that the crypto seems to experience a downward force in an attempt to break past its lower range trading zone. The bearish trend-line has drawn downward across the SMAs to get positioned alongside the smaller SMA to place a key mark at the immediate resistance level of $200. The 50-day SMA indicator has only been intercepted from the top by the 14-day SMA trend-line. The Stochastic Oscillators have visibly crossed from the overbought region to point southbound slightly past range 40. That indicates an amount of downside is in the play.
Will the LTC/USD market get a further drawdown out of ranging zones?
The current active trade moves suggest that there is every possibility that the LTC/USD pair will soon witness a line of further draw-downs in the near trading session. A successful breakdown of the lower trading zone of $150 may in the long run allow the crypto to get a rebound around the immediate support level of $130. However, if after that sentiment comes out successfully, the price may tend to resort to featuring in other ranging style moves below the first mentioned value for a while.
Taking the downside analysis of this market by the reading of Stochastic Oscillators, it’s so much evidence that bears are most likely going to be in the control of this crypto-economy soon. Therefore, the lower range support level of $150 has to breach southward to signify the potentiality of the assumed further drawdown of this crypto trade. Traders needed to be wary of any quick reversal against the attempted downward price move as well.
LTC/BTC Price Analysis
Yet, despite the fall in the trending capacity of Litecoin as paired with Bitcoin, the price analysis chart still reveals that the base crypto is somewhat weighty than the counter crypto. However, the actual current trading situation as depicted on the chart records a line of range-bound moving manner on the buy signal line of the bigger SMA indicator. The 14-day SMA is located a bit over the 50-day SMA indicator as they both point toward the east. The Stochastic Oscillators have crossed downward from the overbought region to point to the south at range 40. That signifies the possibility of getting to a falling pressure that could in the long run pull down the capacity of the base instrument to possibly revisit a previous lower value.
Note: new.cryptosignals.org is not a financial advisor. Do your research before investing your funds in any financial asset or presented product or event. We are not responsible for your investing results.