Wall Street Memes (WSM/USD) Price Firms Up, Igniting Fresh Bids
Estimated Reading Time: 4 minutes
Don’t invest unless you’re prepared to lose all the money you invest. This is a high-risk investment and you are unlikely to be protected if something goes wrong. Take 2 minutes to learn more
Wall Street Memes Price Prediction – July 21
As the pricing dynamics unfold in the market operations of the Wall Street Memes coin paired with the U.S. dollar, selling momentum appears to be gradually diminishing around the $0.0007 level, as the crypto-economic instrument firms up in structure and ignites renewed buying interest with fresh bids.
If the current WSM/USD pattern persists, the oversold positioning of the stochastic oscillators hints at latent buying pressure. This could trigger false downside breakouts that precede a reliable upside reversal. The $0.0007–$0.0006 zone is shaping up as a key technical demand area, potentially fueling momentum-driven long entries upon confirmation through bullish reversal signals or volume surges.
WSM/USD Market
Key Levels
Resistance levels: $0.0009, $0.001, $0.0011
Support levels: $0.0006, $0.0005, $0.0004
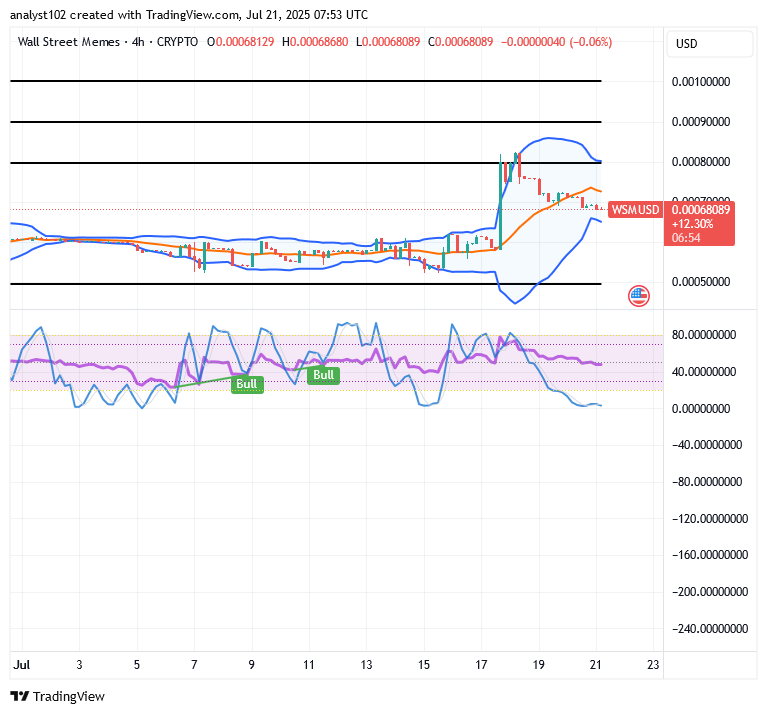
WSM/USD – 4-Hour Chart
It is demonstrated on the WSM/USD 4-hour chart that the crypto-economic business deals form up in their indexes, igniting fresh bids.
The stochastic oscillators are still oscillating within the oversold region, attempting to affirm that the prevailing bearish momentum is gradually weakening and potentially approaching exhaustion. Meanwhile, the Bollinger Bands are reflecting compressed volatility, as a sequence of diminished candlestick sizes continues to form near the lower band—reinforcing the notion of reduced selling pressure and the emergence of a possible preparatory base for a bullish reversal setup.
Given Current Indicator Alignments, Will the WSM/USD Market Decline Sharply in the Next Volatile Phase?
Our overriding bias remains that positions staking proceedings have to continue in the way that the WSM market has been moving in pair with the USD, given that the former firms up in its outlook, igniting fresh bids.
Given the current state of the crypto economy, the asset remains notably undervalued, offering long-term investors the foresight that the underlying instrument is still in its early emergence phase. It is expected to rebound and gain traction, driven by increasing interest from forward-looking capital participants.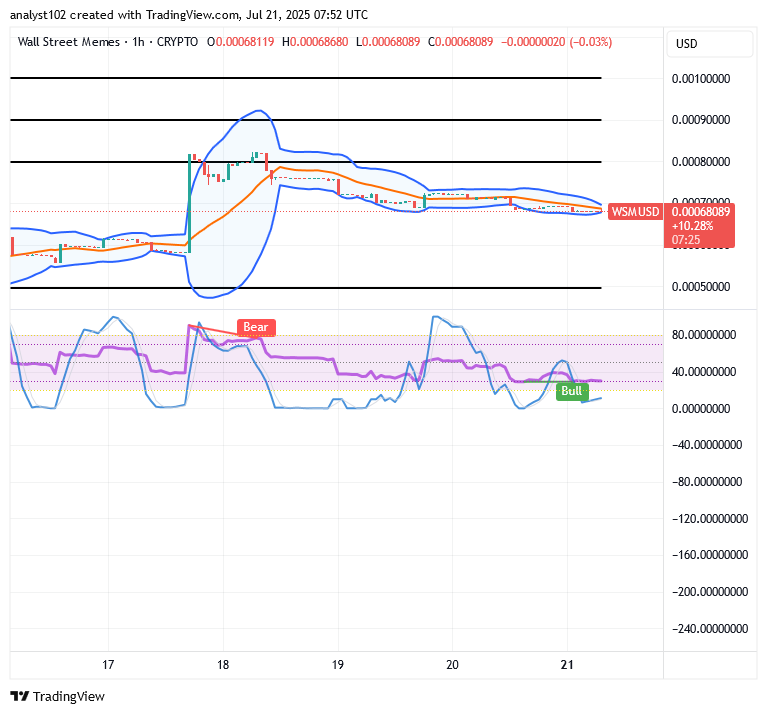
WSM/USD 1-Hour Chart
The WSM/USD market’s 1-hour chart reveals that the crypto-economic market firms up in a steady manner, igniting fresh bids.
The stochastic oscillators are currently seen putting back their way of positioning status together on a threshold to signify the probable resumption of bounces, with convergence patterns subtly emerging to reinforce the signal. The Bollinger Bands are steadily realigning, forming a potential bullish flag configuration with lighter bearish candlesticks, suggesting declining selling momentum and an imminent upward breakout scenario.
We reiterate that no authorized representative from the Wall St Memes team will ever initiate direct contact via private message, nor request sensitive user credentials or any form of personally identifiable information (PII).
Over the last 24 hours, The $WSM token and community has undergone a coordinated attack. The hackers specifically targeted our Discord community.
— Wall Street Memes (@wallstmemes) October 12, 2023
We reiterate that no one from the Wall St Memes team will ever direct message you first, or ask for any personal information – even… pic.twitter.com/VwySpXC7cz