Wall Street Memes (WSM/USD) Trade Shifts, Driftingly Bounces
Estimated Reading Time: 3 minutes
Don’t invest unless you’re prepared to lose all the money you invest. This is a high-risk investment and you are unlikely to be protected if something goes wrong. Take 2 minutes to learn more

Wall Street Memes Price Prediction – July 20
It is presumably showcasing in the market operations of Wall Street Memes coin trading against the purchasing fiat money of the US dollar that the price actions are currently undergoing a necessary reshaping order, given that the crypto-economic trade now shifts, driftingly bouncing around the trade zones of $0.0007.
Right now, the strong signals from the WSM/USD market’s indicators show that there is a clear and ongoing buying trend, which is strongly supporting a rise in prices and aiming to keep them well above the important $0.0006 support level for a long time.
WSM/USD Market
Key Levels
Resistance levels: $0.0009, $0.001, $0.0011
Support levels: $0.0006, $0.0005, $0.0004
WSM/USD – 4-Hour Chart
Today’s trade events on the WSM/USD 4-hour chart show that the crypto-economic market shifts, driftingly bouncing upward between the zones of the Bollinger Bands.
The Bollinger Bands have maintained a northward orientation, indicating a resurgence of upward momentum, with the lower band curving upward near the $0.0006 support zone. Meanwhile, the stochastic oscillators continue to traverse southward, attempting to deepen into the oversold region, signaling potential buildup for a reversal setup.
Are there probable indications of an imminent rebound in the WSM/USD market from the $0.0007 support level?
Current technical oscillators suggest potential downside, but oversold signals portend caution against shorting bias, given that the WSM/USD market is steady, building on uptrend settings.
The prevailing sentiment remains decisively bullish at 75%, outpacing the combined 25% bearish and neutral bias, as momentum indicators confirm steady upward drive. Minor retracements to $0.0007 are likely re-accumulation setups underpinned by strength, marking preparatory stages for a renewed leg higher.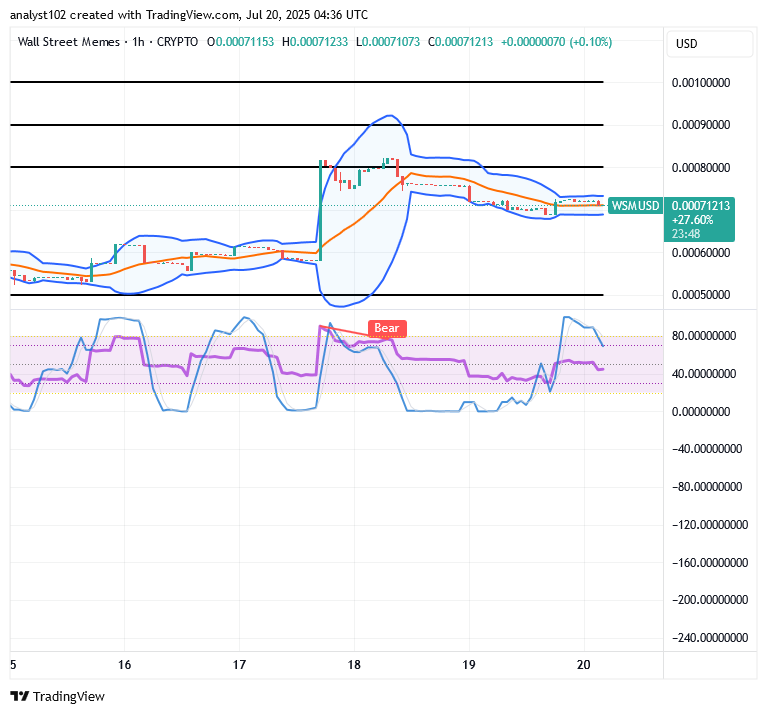
WSM/USD 1-Hour Chart
The WSM/USD market’s 1-hour chart showcases that the crypto-economic trade shifts, driftingly bouncing in its inputs.
The Bollinger Bands are steadily realigning, forming a potential bullish flag configuration despite a minor downward retracement. Meanwhile, the stochastic oscillators have surged northward into the overbought region, even under a prevailing bearish signal structure, suggesting that long-term buyers are beginning to absorb pullbacks and regain control.
Over the past 24 hours, the $WSM token and its community experienced a coordinated cyberattack, primarily targeting our official Discord channel in an attempt to disrupt operations and compromise communication integrity.
BIGTIMEUSDT & WSMUSDT contracts are now fully launched on Bybit — unlock powerful trading opportunities today!
🚀 BIGTIMEUSDT & WSMUSDT Contracts now on Bybit!
— Bybit (@Bybit_Official) October 12, 2023
Dive into new trading opportunities with 1-25x leverage. Plus, they’re now on Bybit Futures Grid Bot! Start trading now.
📈 BIGTIME: https://t.co/FAQlbhnzAh
📈 WSM: https://t.co/pb2y2AfMBE#CryptoTrading #Bybit