Polygon (ex-MATIC) Price Prediction: POL/USDT Bounces Back After Steep Dive
Estimated Reading Time: 2 minutes
Don’t invest unless you’re prepared to lose all the money you invest. This is a high-risk investment and you are unlikely to be protected if something goes wrong. Take 2 minutes to learn more

Polygon (ex-MATIC) Price Prediction for October 26
The price action of the Polygon (ex-MATIC) token recently experienced a steep dive, reaching a new low. However, the ongoing session has rebounded upward at the $0.3200 threshold.
POL/USDT Long-term Trend: Bullish (Daily Chart)
Key Price Levels:
Resistance: $0.3300, $0.3500, $0.3700
Support: $0.3200, $0.3000, $0.2800
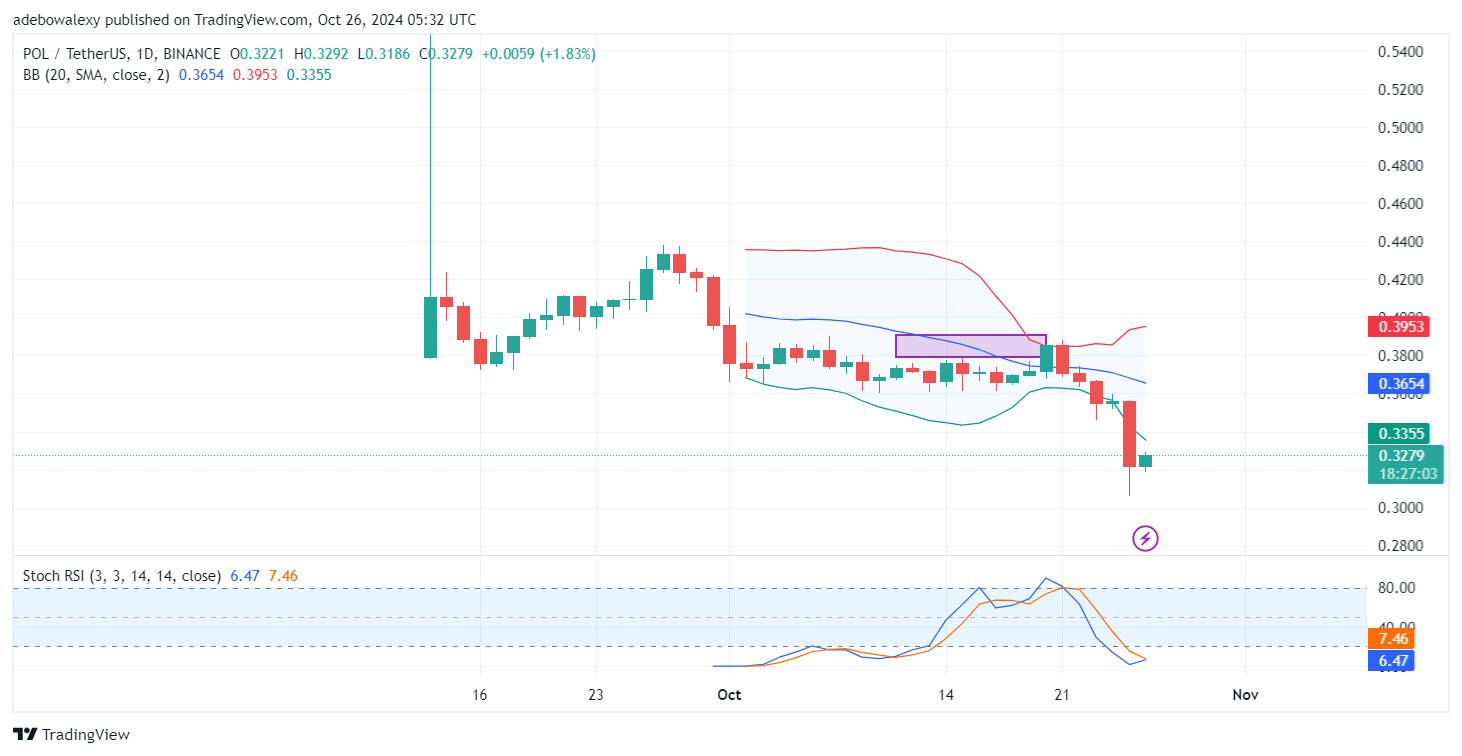
Trading activities in the Polygon market are ongoing below the lower limit of the Bollinger Bands indicator. The latest price candle has turned green, standing just above the $0.3200 threshold. Additionally, the Stochastic Relative Strength Index (RSI) lines are in the oversold region and are now converging for an upward crossover. This aligns with the price movement in the current session.
Polygon (ex-MATIC) Price Prediction: POL/USDT Shows Signs of Recovery Amid Increased Participation
Price activity in the Polygon market has been on a steady downward trajectory, with a sharp decline occurring in the previous session. The market has since rebounded above the $0.3200 threshold, with the current session continuing to show signs of recovery despite remaining below the lower Bollinger Bands limit.
At the same time, the Stochastic RSI lines are converged in the oversold region. Although the current session may appear generally bearish, indicators suggest the potential for short-term gains.
Polygon (ex-MATIC) Price Prediction: Will POL/USDT Continue Its Upside Recovery? (4-Hour Chart)
In the Polygon (ex-MATIC) 4-hour market, price action has recovered above the lower limit of the Bollinger Bands. However, the last price candle has contracted downward, resulting in an upper shadow. Additionally, the Stochastic RSI lines have completed an upside crossover below the 20 level on the indicator.
Technically, the upside rebound has the potential for continuation. However, caution is warranted, as the overall downward trend remains in place. Consequently, traders may wish to wait until the upward retracement surpasses the $0.3400 threshold before making bullish moves targeting the $0.3750 price level.