Solana (SOL) Maintains Its Buoyancy
Estimated Reading Time: 3 minutes
Don’t invest unless you’re prepared to lose all the money you invest. This is a high-risk investment and you are unlikely to be protected if something goes wrong. Take 2 minutes to learn more

Summary:
- SOL fell over 2%, but remains above the key $72.52 support.
- Selling pressure persists, though buyers are defending the support level.
- A rebound could target $100–$120 if the support holds.
The Solana blockchain continues to experience strong network activity. However, the token has declined by more than 2% today. Despite this pullback, price action remains above a key medium-to-long-term support level, suggesting the broader bullish structure remains intact.
Solana 24-Hour Chart
The SOL market has followed a mild downward trend since early July. As of today, the token has fallen by more than 2%. Nevertheless, it continues to hold above the $72.52 support level, which represents a crucial price floor on the daily chart.
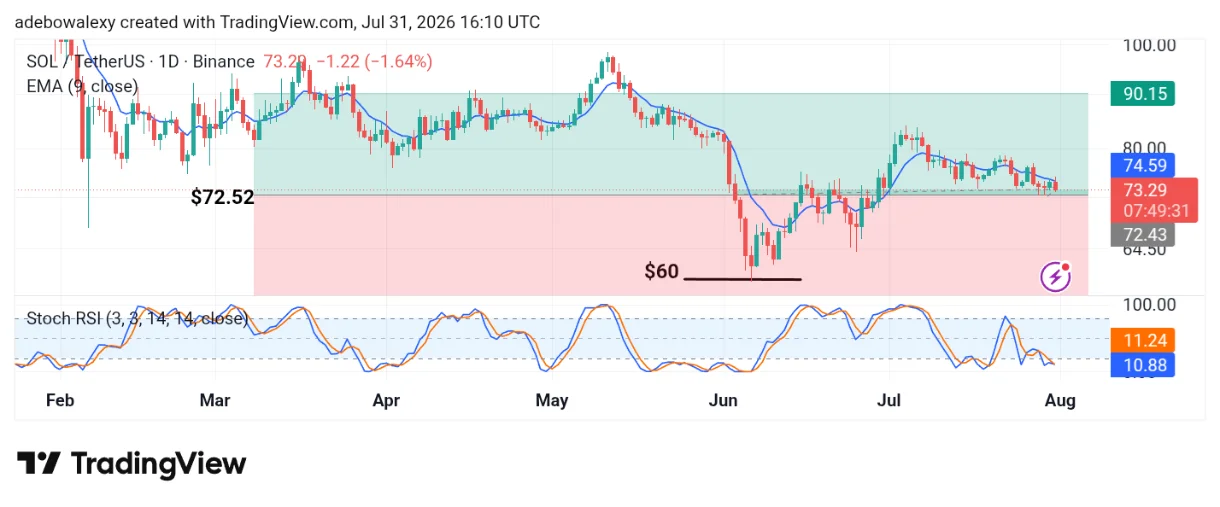
As a result, SOL is currently trading below the 9-day Exponential Moving Average (EMA). Meanwhile, the Stochastic Relative Strength Index (SRSI) lines remain close together and appear to be pointing lower, reflecting the ongoing corrective phase in the market.
The $72.52 Level Remains a Key Support for Solana
As observed on the SOL/USDT daily chart, price action continues to trend lower. However, the market has found strong support at $72.52. Over the past three trading sessions, the price has repeatedly tested this support without breaking below it.
Additionally, the SRSI remains in the oversold region and is showing signs of a bearish crossover. Even so, the market’s ability to hold above the $72.52 level suggests that buyers are actively defending this price zone.

Solana Retains a Bullish Long-Term Outlook
Despite the recent price weakness, the Solana blockchain continues to record impressive network activity, recently settling approximately $611 million in payments. This strong on-chain activity may help explain why sellers have struggled to push the market below the $72.52 support level.
As a result, traders may anticipate a rebound from this region if buying pressure strengthens. Should the support continue to hold, SOL could recover toward the $100 level, with the $120 price region emerging as the next medium-term upside target.