Solana (SOL) Price Prediction: SOL/USDT Price Action Breaks into the $170 Price Region
Estimated Reading Time: 3 minutes
Don’t invest unless you’re prepared to lose all the money you invest. This is a high-risk investment and you are unlikely to be protected if something goes wrong. Take 2 minutes to learn more
Solana (SOL) Price Prediction: October 25
The SOL/USDT market has broken the resistance at the $170 threshold level. However, today’s trading has recorded a downward retracement, yet the market seems generally on its way towards a two-month high at $180 and $185.
SOL/USDT Long-term Trend: Bearish (Daily Chart)
Key Price Levels:
Resistance: $180, $185, $190
Support: $175, $170, $165
Price movement in the Solana daily market appears to be hugging the upper band of the Bollinger Bands. Meanwhile, the last price candle on the chart shows a downward deflection following an extended period of pushing against the upper limit of the Bollinger Bands indicator. Consequently, the Stochastic Relative Strength Index (Stochastic RSI) has delivered a bearish crossover in the overbought region. The resulting lines of the indicator are now extending slightly toward the 80 mark.
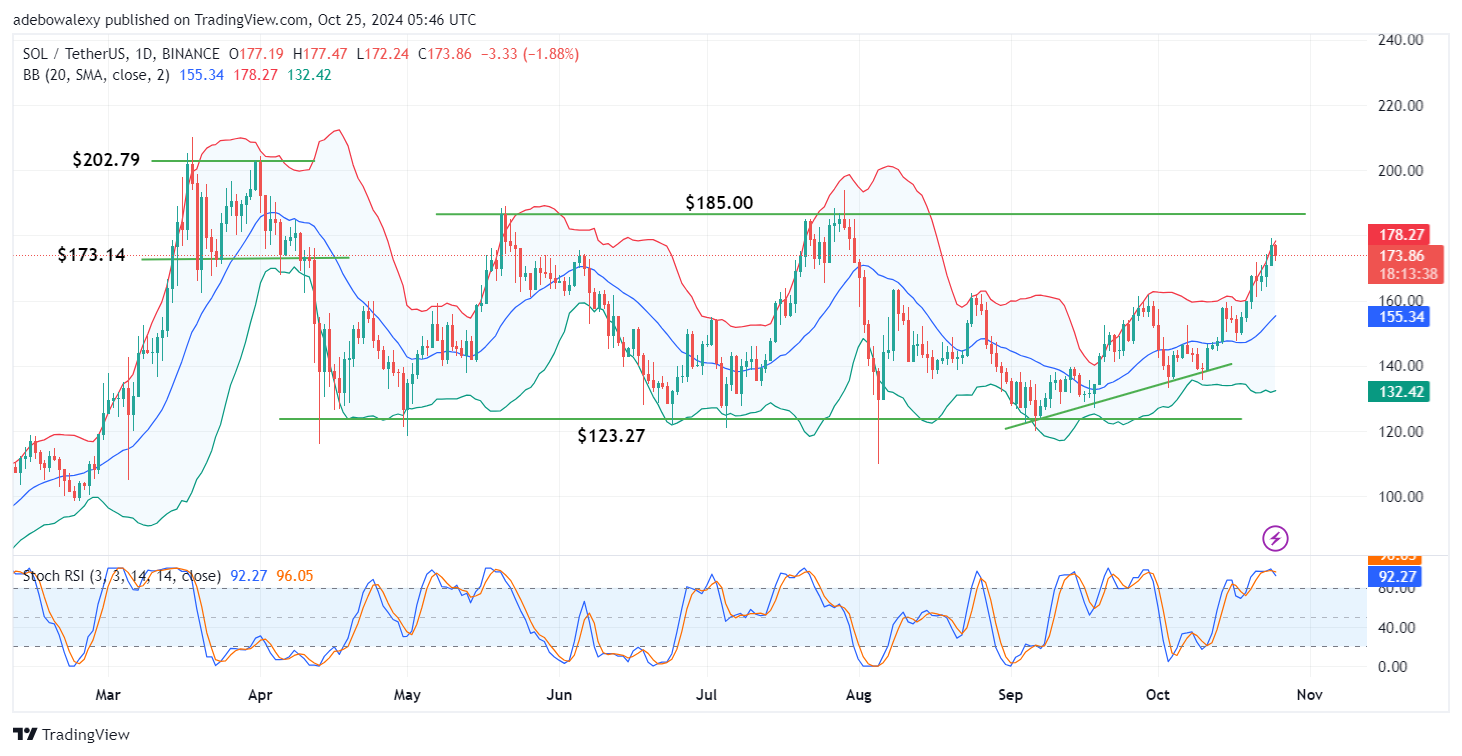
Solana (SOL) Price Prediction: SOL/USDT Uptrend May Still Be on
The Solana market has been on an upward correction since it formed a “W” pattern off an upward-sloping trendline. Upward momentum gained significant strength following this pattern, pushing the price action against the upper band of the Bollinger Bands.
The current session shows a downward retracement with the latest red candle on the chart. Additionally, the Stochastic RSI lines indicate a similar downward retracement. The resulting lines of this indicator are proceeding downward but remain significantly above the 80 mark, suggesting that the uptrend can still be considered intact.
Solana (SOL) Price Prediction: Will SOL/USDT Downward Retracement Persist? (4-Hour Chart)
In the Solana 4-hour market, the previously mentioned downward retracement has continued for the past two sessions, resulting in three straight sessions of downward movement. The latest price candle remains red but has a longer lower shadow. Also, trading activity is still above the middle band of the Bollinger Bands. Meanwhile, the leading lines of the Stochastic RSI indicator have crossed below the 80 threshold.
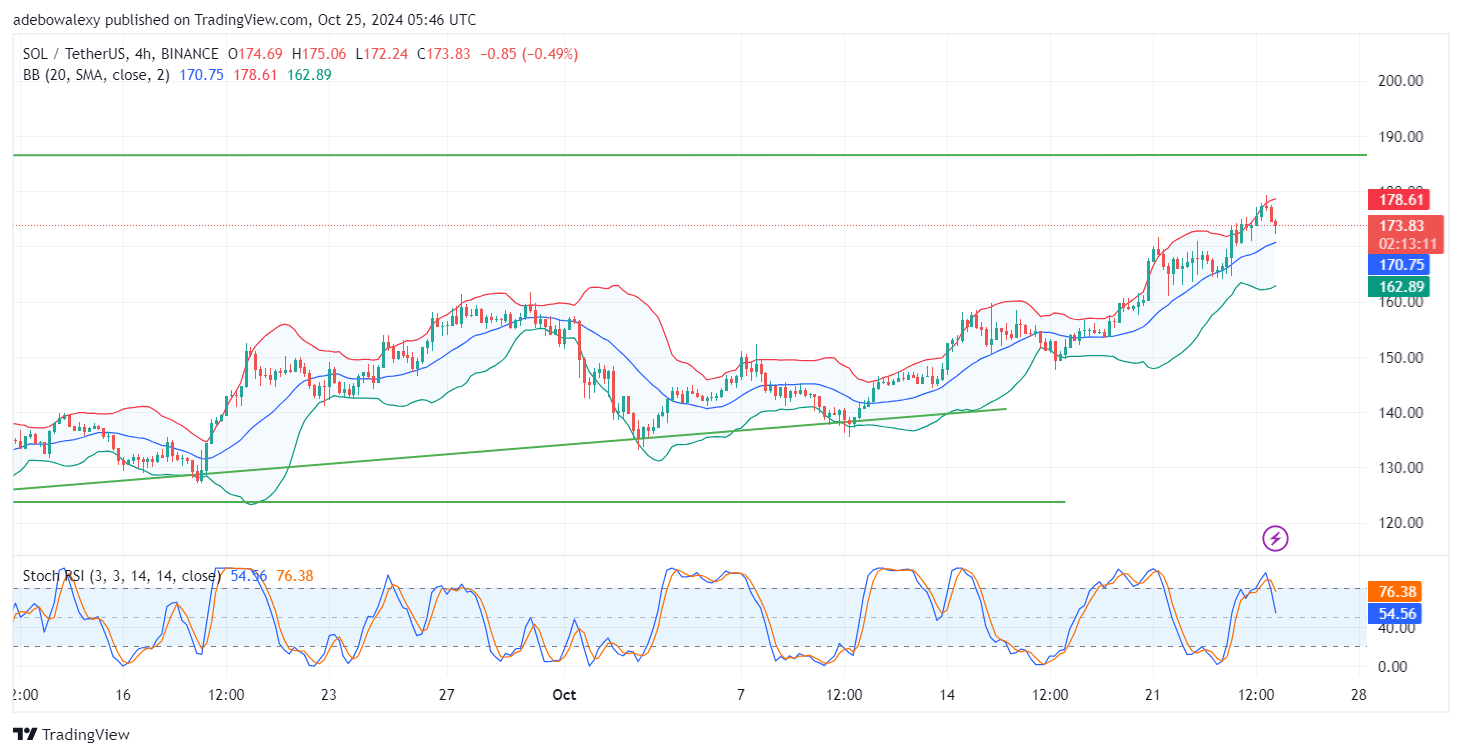
While price activity remains above the middle Bollinger Band, it may be premature to conclude that the downward retracement will continue. Additionally, the latest price candle shows that upward forces are still active, as indicated by the lower shadow on the last candle. Therefore, traders anticipating the upward correction may expect a rebound soon, possibly from the middle Bollinger Band. However, if the price action breaks this support, the retracement could reach the $165 level.