Uniswap (UNI) Price Prediction: UNI/USDT Maintains Steady Upward Trend
Estimated Reading Time: 3 minutes
Don’t invest unless you’re prepared to lose all the money you invest. This is a high-risk investment and you are unlikely to be protected if something goes wrong. Take 2 minutes to learn more

Uniswap (UNI) Price Prediction: October 24
Price action in the Uniswap daily market continues to maintain its upward focus. This is evident as the token has broken through another technical resistance level. Let’s carefully examine the technical indicators for more insights into this market.
UNI/USDT Long-term Trend: Bullish (Daily Chart)
Key Price Levels:
Resistance: $8.50, $9.00, $10.00
Support: $7.50, $7.00, $6.50
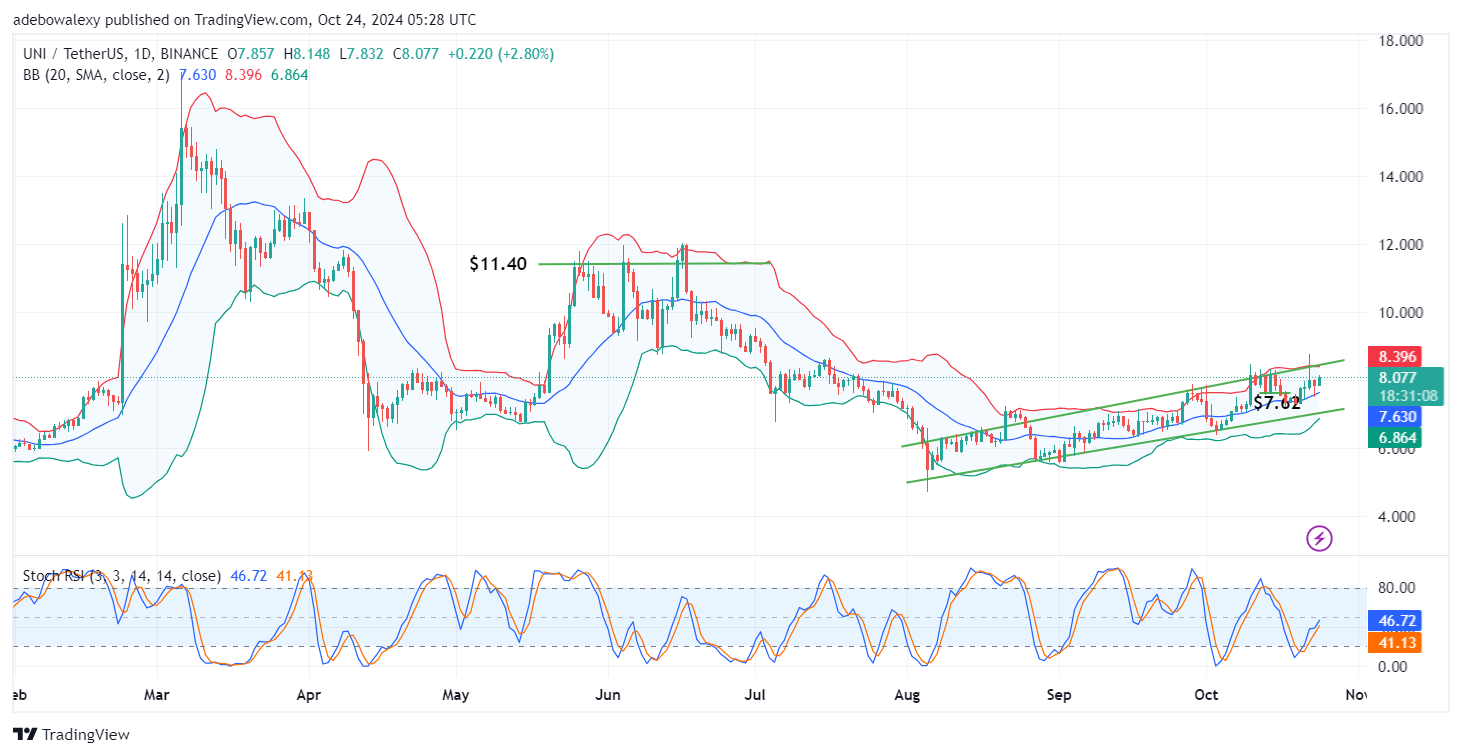
Ever since the price action tested the ceiling of the upward-sloping price channel, trading activity has been taking place above the middle band of the Bollinger Bands. Thanks to the latest price candle on the chart, the Uniswap token is now trading above the $8.00 threshold. The Bollinger Bands also show a slight upward trajectory. Similarly, the Stochastic Relative Strength Index (Stochastic RSI) lines are still rising toward the 50 mark on the indicator.
Uniswap (UNI) Price Prediction: UNI/USDT May Edge Higher
The latest price candle in the Uniswap market reflects a significant bullish move. With this occurring above the middle band of the Bollinger Bands indicator, it hints that buyers may be gaining strength. This could lead to further price increases in this market as trading activity progresses.
The upward trajectory of the Stochastic RSI lines also aligns with the fact that the market remains bullish. Consequently, this supports the view that upward momentum is still in play and could result in further price retracement above the $8.00 mark.
Uniswap (UNI) Price Prediction: UNI/USDT Price Continues to Rise (4-Hour Chart)
Extending the Uniswap price analysis to a 4-hour chart, it becomes clear that buyers are maintaining their advantage in the new session. The latest price candle on the chart is green and appears above the middle Bollinger Band, with the indicator bands remaining fairly wide to allow for more volatility. The new session has pushed the market further above the $8.00 mark.
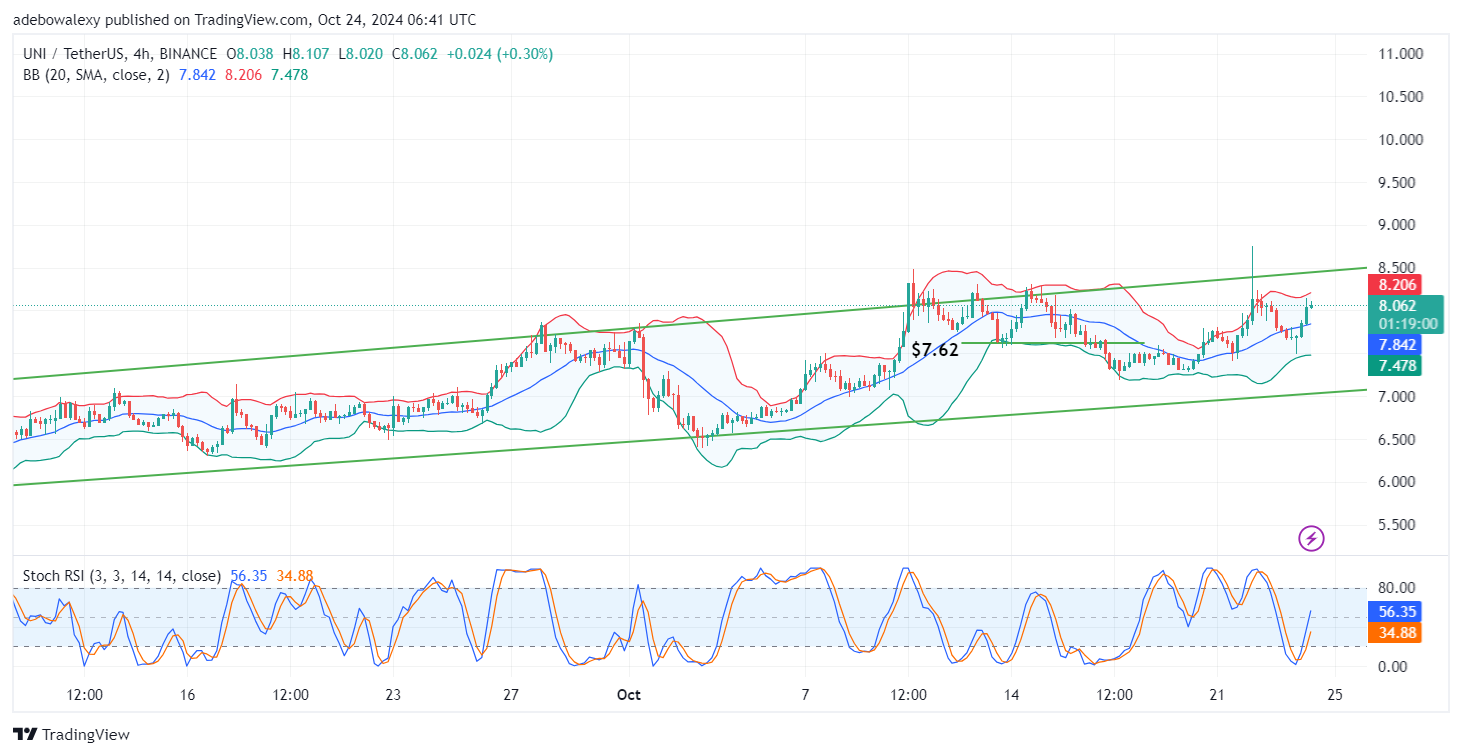
The Bollinger Bands maintain a slight upward trajectory, while the Stochastic RSI lines continue to point upward from the oversold region. As a result, the current market indicators suggest that price action may continue to rise. Based on available signals, traders in this market may target the $8.50 or $9.00 levels for short-term gains.