Uniswap (UNI/USD) Market Declines, Finding Support
Estimated Reading Time: 3 minutes
Don’t invest unless you’re prepared to lose all the money you invest. This is a high-risk investment and you are unlikely to be protected if something goes wrong. Take 2 minutes to learn more
Uniswap Price Prediction – September 23
It recorded that the UNI/USD market declines, finding support around a lower trading line of $20. The crypto’s price is at an average percentage rate of -0.23, trading around the level of $21. There is a sign that the crypto-fiat pair is again striving to regain its worth from the low-trading axis.
UNI/USD Market
Key Levels:
Resistance levels: $25, $30, $35
Support levels: $18, $16, $14
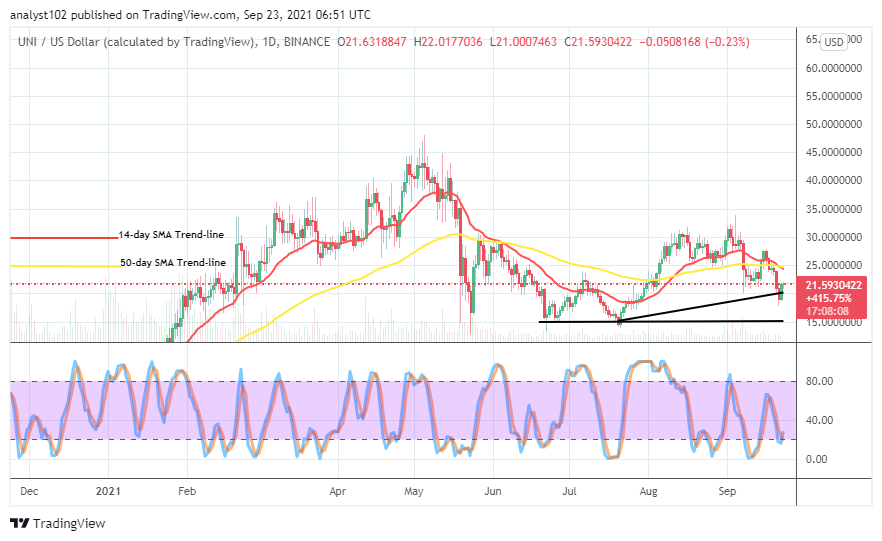
UNI/USD – Daily Chart
The UNI/USD daily chart showcases that the crypto market declines, finding a support level beneath the SMA trend lines. The 50-day SMA indicator has been touched at the top by the 14-day SMA indicator. A bullish candlestick has emerged against the $20 trading level, signifying a promissory return of probable upswings in the following days. The Stochastic Oscillators have southbound to cross the lines briefly upward at range 20, aiming to indicate a near return of an upswing.
Would there still be a further drop beneath the $20 level as the UNI/USD market declines, finding support?
A further dropping beneath the $20 level will potentially allow more opportunities of joining the crypto economy at a cheaper amount as even that the UNI/USD market declines, finding support. Long-position traders are to look out for active pull-ups beneath the SMAs before exerting a buy order. At this level of trading, investors may join the market, not minding any pulling-up situation.
On the downside, the UNI/USD market bears may still momentarily prey on the left-over of recent downward force while the price couldn’t rally past either around $23 or $25 in its current upward-striving efforts. A strong rejection of price movement at the higher value-line may, in the long run, give way to visible interception between the SMA trend lines to consolidate the return of downward motions once again.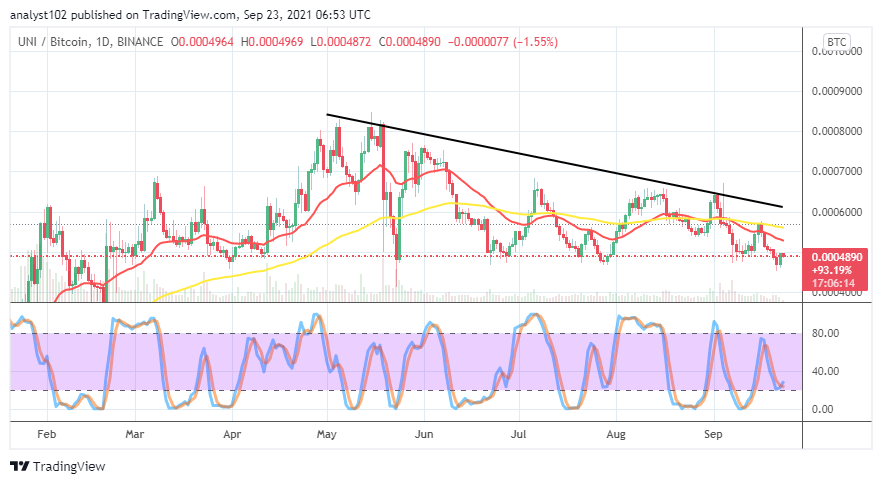
UNI/BTC Price Analysis
In comparison, the UNI/BTC price analysis chart exhibits that the duo-crypto market declines, finding support. In other more technical explanatory talks, the base crypto has been put under pressure by the flagship counter crypto. The 14-day SMA indicator is underneath the 50-day SMA indicator as the bearish trend line drew above them. The Stochastic Oscillators have touched the range of 20, briefly attempting to cross the lines back to the north. That signifies that the UNI market may in the near time regain its trending capability as paired with BTC.
Note: Cryptosignals.org is not a financial advisor. Do your research before investing your funds in any financial asset or presented product or event. We are not responsible for your investing results.
You can purchase crypto coins here. Buy Tokens