Tamadoge (TAMAUSD) Bullish Trend May Be Triggered at the $0.00900 Price Level
Estimated Reading Time: 3 minutes
Don’t invest unless you’re prepared to lose all the money you invest. This is a high-risk investment and you are unlikely to be protected if something goes wrong. Take 2 minutes to learn more
The Tamadoge bulls faced significant challenges in attempting to stage a recovery at the $0.010 price level, primarily due to sustained selling pressure. Currently, they are regrouping and consolidating at the $0.00900 price level.
The market exhibits promising signs of a potential recovery, notably because it has consistently held above this level since September 17, with no further decline below it. This consistent consolidation around the $0.00900 price point is gradually establishing a robust support level from which a potential price rebound could originate.
Key Levels
- Resistance: $0.013, $0.014, and $0.015.
- Support $0.0091, $0.0087, and $0.00800.
TAMAUSD Price Analysis: The Indicators’ Point of View
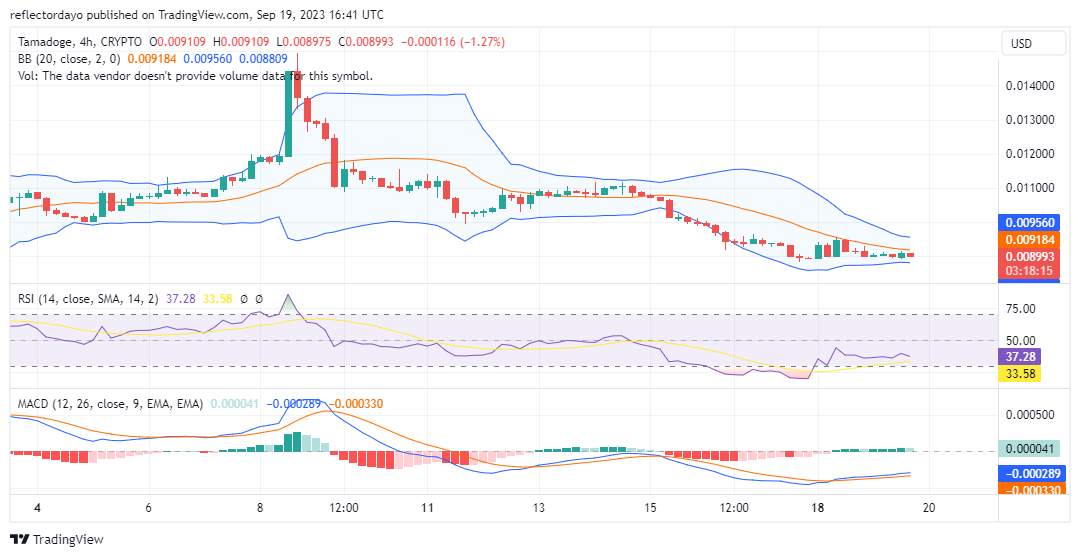
As the Tamadoge price action hovers near the $0.009 price level, let us take note that the Bollinger Bands are showing signs of convergence around this level. This convergence suggests the potential for an imminent breakout, which, given the context, could favor an upward trajectory.
Ranging at a critical support level without descending below it often indicates the possibility of a sentiment reversal in the market. Should buyers actively participate and propel the price higher while effectively defending this support level, it may serve as a significant indicator of a transition from a bearish to a bullish trend. Such a shift could potentially trigger an upward price breakout.
 Tamadoge Short-Term Outlook: 1-Hour Chart
 Tamadoge Short-Term Outlook: 1-Hour Chart
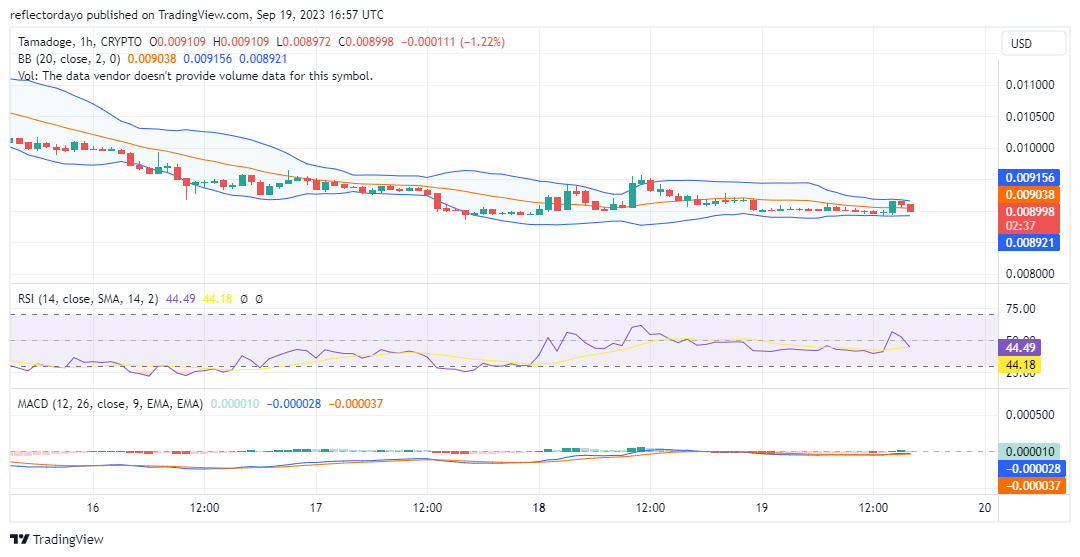
The 1-hour timeframe analysis provides further insight into the Tamadoge market, revealing a predominantly horizontal movement pattern. However, when examining the indicators, it becomes apparent that the market has been trading within the sell zone.
The Bollinger Bands indicator, in particular, has shown noteworthy fluctuations within a narrowing price channel during recent 1-hour trading sessions. This observation suggests that the market may be in the process of consolidating, potentially setting the stage for a bullish breakout.
We are preparing for Part Two of our roadmap for the mystery project.
We’re getting ready for Part Two of our mystery project roadmap 🌕
What do you want to see coming up next from team Tamadoge? 🔥 pic.twitter.com/hbdCRXqD2l
— TAMADOGE (@Tamadogecoin) September 19, 2023
Do you want a coin that will be 100 times more valuable in the next few months? That is Tamadoge. Buy TAMA today!