Solana (SOL) Price Prediction: SOL/USDT Holds on to the Base Above $200
Estimated Reading Time: 3 minutes
Don’t invest unless you’re prepared to lose all the money you invest. This is a high-risk investment and you are unlikely to be protected if something goes wrong. Take 2 minutes to learn more

Date: September 5, 2025
After the Solana market witnessed a moderate comeback on Tuesday, the market quickly edged lower. However, the ongoing session has presented resistance to further bearish progress. As such, price action here has maintained its base above a key technical support.
Long-Term Trend — Bullish (Daily Chart)
Key Price Levels:
Resistance: $210, $215, $220
Support: $200, $195, $190
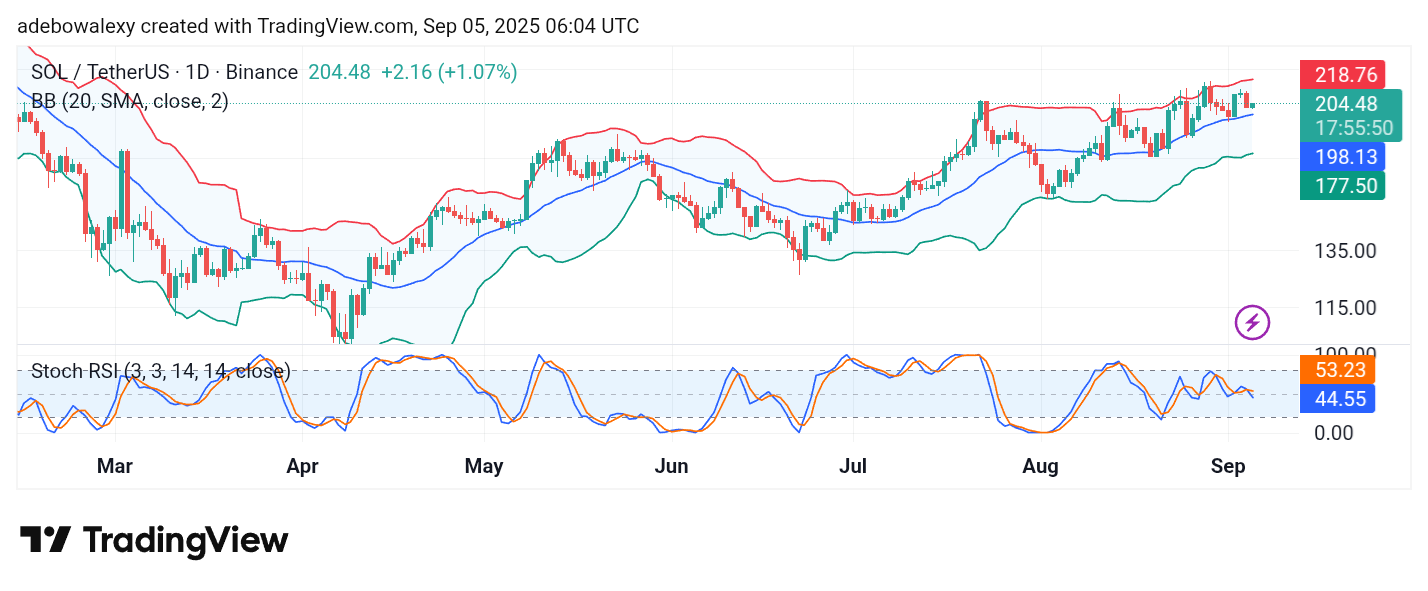
The ongoing session in the Solana daily chart has posed resistance to further downward retracement. The last price candle on this chart appeared green and above the middle limit of the Bollinger Bands (BB) indicator. Also, the BB indicator continues to rise slightly upward. Meanwhile, the lines of the Stochastic Relative Strength Index (SRSI) recently delivered a downward crossover, and the lines maintain a slight downward trajectory.
Solana (SOL) Price Prediction: SOL/USDT Holds a Bullish Perspective
The ongoing session in the Solana market is represented by a small but green price candle. However, its base above the middle limit of the BB indicator on the daily chart suggests a promising outlook. Likewise, it can be observed that price action has been making higher highs of late, indicating that the market is in an upward trend.
At the same time, the SRSI indicator lines can be seen keeping a slight upward bearing, signaling the general trend in the market. On the contrary, the SRSI lines recently delivered a downward crossover due to the recent sharp price drop. Be that as it may, a stronger upward correction may trigger a trajectory change in the market.
Solana (SOL) Price Prediction: SOL/USDT Bulls Are Making Steady but Modest Progress (4-Hour Chart)
On the shorter time frame of the 4-hour chart, the Solana market has maintained a steady bullish path over the past two sessions. A closer look at the corresponding price candles reveals that price action may be experiencing increased bullish momentum.
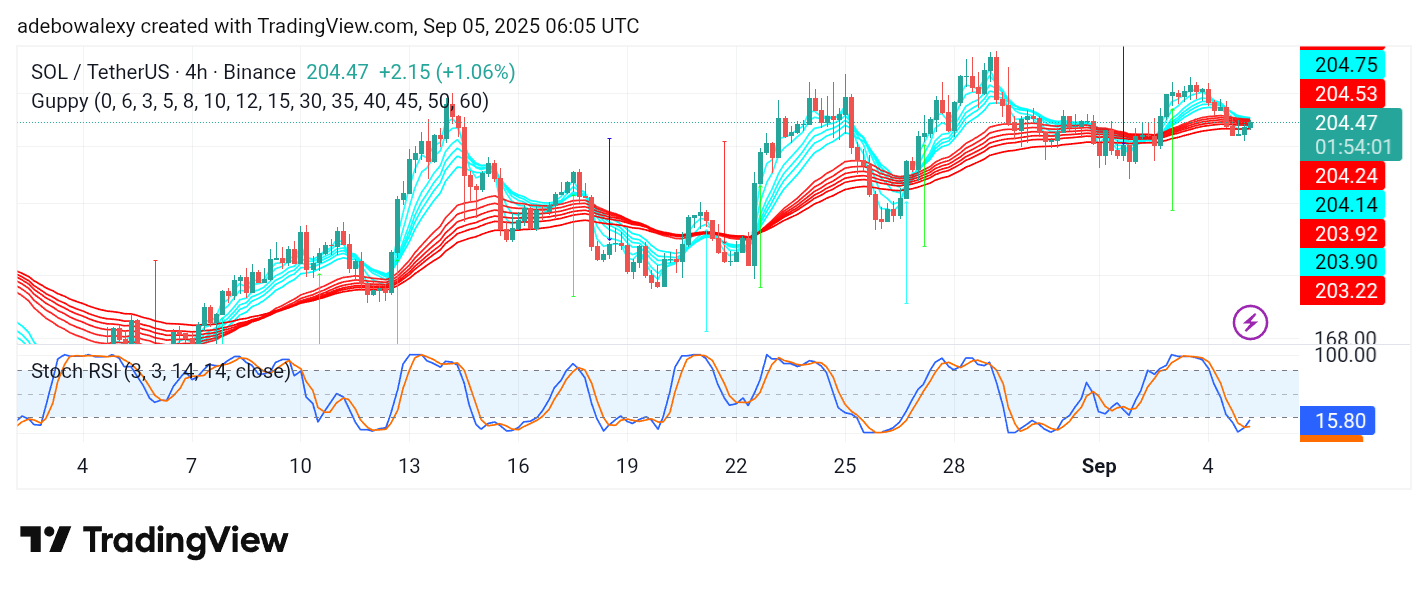
As a result, price action is rising through the converging Guppy Multiple Moving Average (GMMA) curves. At the same time, the SRSI indicator lines have delivered an upward crossover.
The lines of the GMMA curves are also converging for a bullish crossover. The bearing of the SRSI lines aligns with the upward movement in price action, suggesting a climb toward the $210 level may occur.