Solana (SOL) Price Prediction: SOL/USDT Heads Towards $220
Estimated Reading Time: 3 minutes
Don’t invest unless you’re prepared to lose all the money you invest. This is a high-risk investment and you are unlikely to be protected if something goes wrong. Take 2 minutes to learn more

Date: August 28, 2025
Price activity in the Solana market has gained significant traction over the recent past. It appears that buyers have found the conviction they needed to resume buying. This has caused the market to experience increased volatility over the past seven days, with buyers taking profits as the market rises.
Long-Term Trend — Bullish (Daily Chart)
Key Price Levels:
Resistance: $220, $230, $240
Support: $210, $200, $180
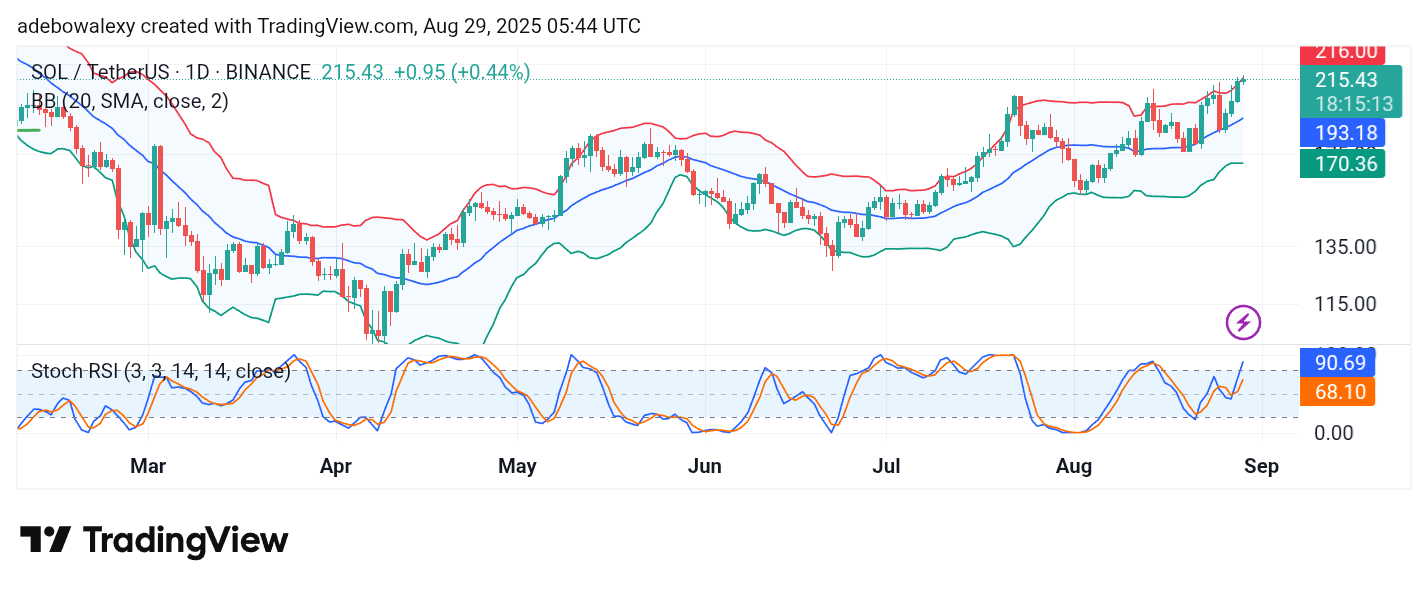
The Solana market recently regained notable traction. The last price candle on the token’s daily chart is a small green one. Alongside this, price action is pushing against the uppermost band of the Bollinger Bands (BB) indicator. The BB indicator itself is now tilted upward in response to growing bullishness. Meanwhile, the lines of the Stochastic Relative Strength Index (SRSI) indicator are sharply projected upward into the overbought region.
Solana (SOL) Price Prediction: SOL/USDT Retains a Good Stand
Bullish momentum has held sway for a significant period of time in the Solana market. As a result, the market has breached the $200 and $210 price thresholds. The market has been on an upward path for four consecutive sessions.
The last price candle on the chart remains green but is significantly smaller than the previous ones. Meanwhile, it is pushing against the uppermost limit of the BB indicator. At the same time, the BB indicator itself is shaping to reflect the prevailing bullish trend. The SRSI indicator lines are rising steeply into the overbought region, supporting the view that bulls remain active.
Solana (SOL) Price Prediction: SOL/USDT Bullish Strength May Be Giving Way (4-Hour Chart)
The Solana market on the daily chart has maintained a straight bullish record for four consecutive sessions. However, the 4-hour price chart shows that a downward rebound has occurred in the ongoing session. Nevertheless, the BB indicator retains an upward trajectory.
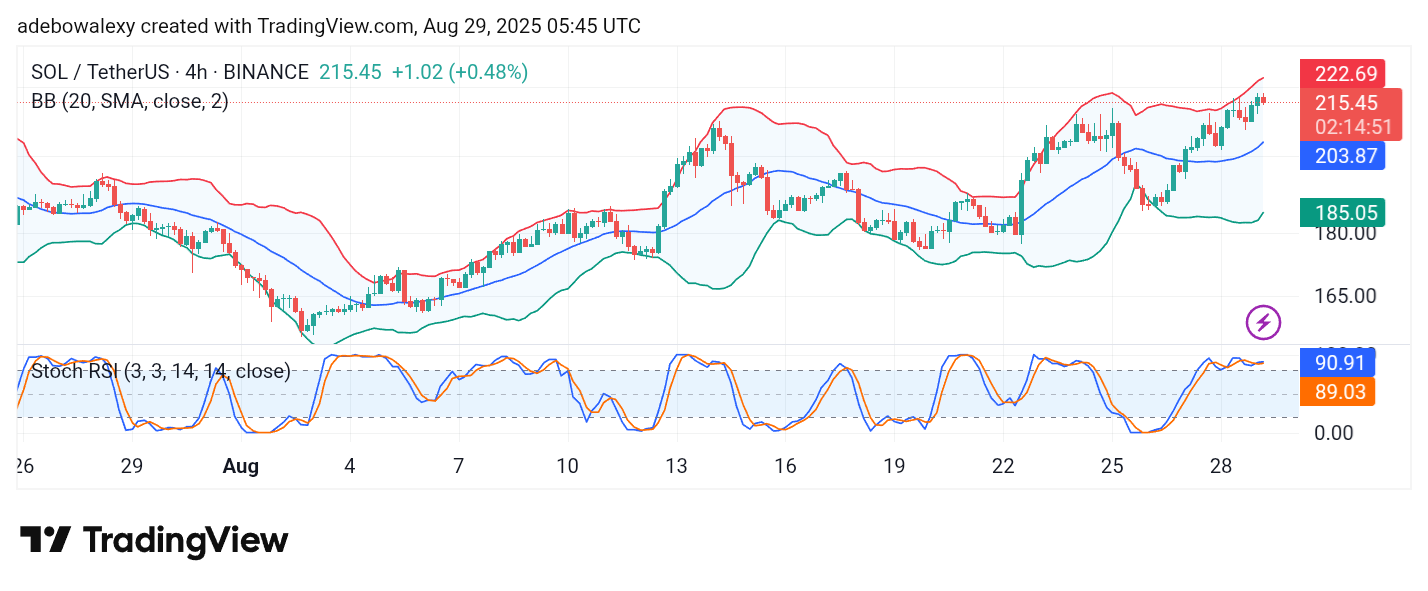
Meanwhile, SRSI lines are moving sideways in the overbought region. Considering this, and the fact that a clear crossover has not yet occurred, traders can maintain an optimistic stance that the upward retracement may extend. Technically, this follows the rule of price action staying above the middle band of the BB indicator, as reflected on the 4-hour price chart. Therefore, the \$220 price mark remains a valid target.