SPONGE/USD ($SPONGE) Struggles at Lows – Perfect Dip-Buying Opportunity?
Estimated Reading Time: 3 minutes
Don’t invest unless you’re prepared to lose all the money you invest. This is a high-risk investment and you are unlikely to be protected if something goes wrong. Take 2 minutes to learn more

The $SPONGE market has remained in a consolidation phase, which began around the key support level of $0.000000000256. The sustained price stability near this level suggests a potential upward movement, as the market has maintained a steady price channel for some time.
Notably, traders appear to be accumulating at this low, contributing to the ongoing consolidation. Increased buying activity around the $0.000000000256 mark is helping to stabilize the market, indicating that the bearish momentum in this crypto signal may be fading. If this support level holds, it could serve as a foundation for a potential recovery.
Key Levels to Watch
- Resistance: $0.0000000140, $0.0000000145, $0.000000015
- Support: $0.000000000200, $0.000000000190, $0.00000000018
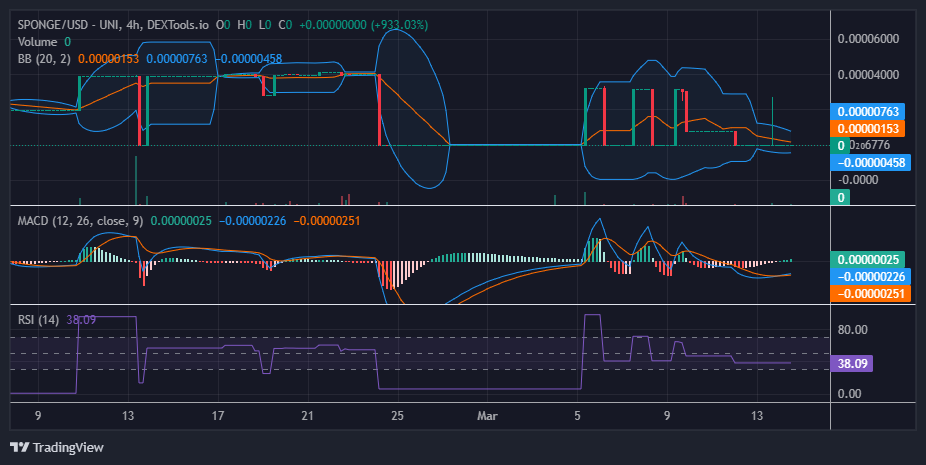
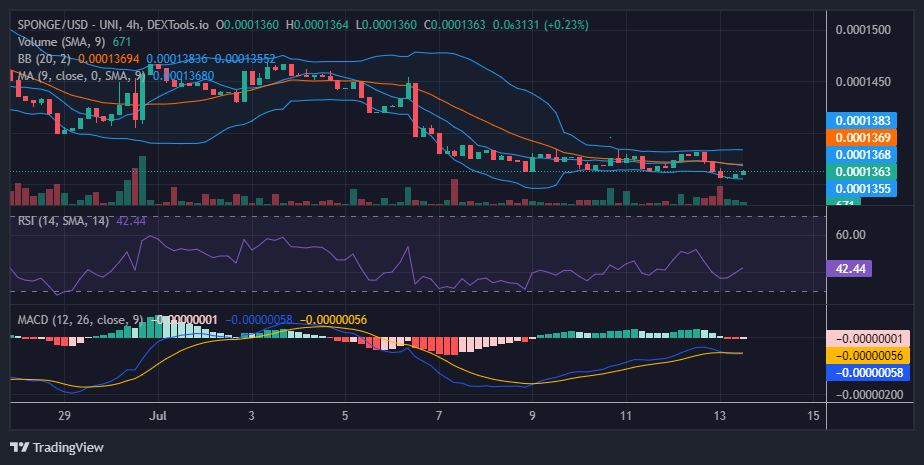
SPONGE/USD Market Outlook
With selling pressure easing near $0.000000000256, traders may find a buying opportunity at this level, as the $SPONGE market has maintained a stable price channel for some time. The well-defined support and resistance zones create a strategic trading setup, allowing traders and investors to capitalize on price movements for potential returns.
Buying near support and selling at resistance remains an effective approach. If historical trends persist, the market could be preparing for another bullish phase. Additionally, there is still potential for a breakout that could establish a sustained upward trend.
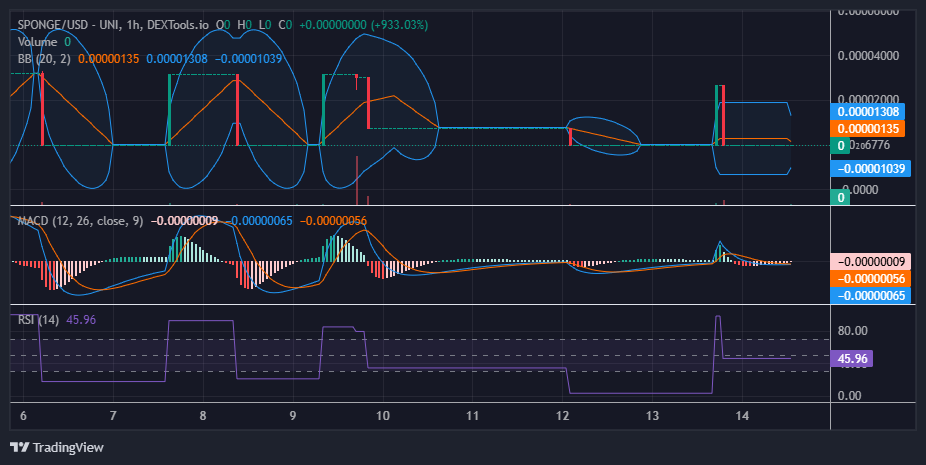
SPONGE/USD 1-Hour Chart Analysis
A closer look at the 1-hour chart reveals shifting momentum. Initially, the MACD signaled strengthening bullish activity, with its lines approaching a breakout above zero. However, a sudden bearish push stalled the recovery. Now, with the RSI dipping into oversold territory, the likelihood of a price rebound is increasing.
If buyers step in at this critical level, rising volatility could trigger a sharp upward move, creating short-term trading opportunities. Such indicator readings often reinforce bullish sentiment among traders, potentially driving increased buying activity.
Buy SPONGE/USD!
This is what alt season will feel like 💦 pic.twitter.com/iw22ZIoqv9
— $SPONGE (@spongeoneth) March 8, 2025
Join the SPONGE community and be part of the next big crypto sensation! Buy Sponge ($SPONGE) today!