Wall Street Memes (WSM) Trade Holds on, Conjecturing Hikes
Estimated Reading Time: 3 minutes
Don’t invest unless you’re prepared to lose all the money you invest. This is a high-risk investment and you are unlikely to be protected if something goes wrong. Take 2 minutes to learn more
Wall Street Memes Price Prediction – February 24
The trading propensity that characterized the existence of buyers and sellers in the business operations of the Wall Street Memes coin pairing with the valuation level of the US dollar now holds on, conjecturing hikes in its signaling output.
The market’s trading formation setup has been systematically characterized by progressively lighter lower lows, with a consolidation phase building around the middle Bollinger Band and just above the lower boundary of the indicators. Currently, the supporting forces behind upward price movements appear to be in a temporary pause, as momentum stabilizes. This pause suggests a tactical environment for accumulating positions, with a focus on dip-buying strategies as the market maintains its overall consolidation phase, awaiting a potential reacceleration in bullish activity.
WSM/USD Market
Key Levels
Resistance levels: $0.002, $0.0025, $0.003
Support levels: $0.001, $0.0008, $0.0006
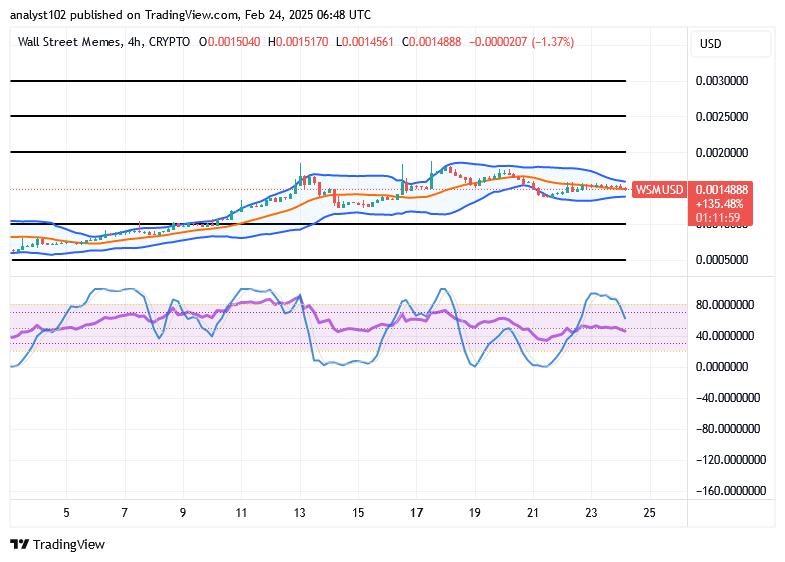
WSM/USD – 4-hour Chart
The medium-term chart (4-hour chart) of the WSM/USD trade holds on steadily, conjecturing hikes in inputs.
A repositioning pattern is observed in the stochastic oscillators, which are moving through varying value levels, accompanied by candlestick formations that reflect a series of smaller price movements. Meanwhile, the Bollinger Bands have remained extended horizontally, with price action fluctuating between the $0.002 and $0.001 levels.
Will the upcoming busy sessions see more sellers than buyers as the WSM/USD market continues to push in ranges?
There has been no significant indication to signify probable conditions that can set up the pricing velocities of the WSM/USD market operations steadily to the negative side, as the current financial situation shows that base economy holds on, conjecturing hikes.
As repeatedly emphasized, the trade outlook for the pairing instruments suggests that executing more buying positions is preferable to considering selling. Moreover, the current selling pressure is likely to create opportunities for well-timed buybacks at key support levels, facilitating potential entry points for long positions.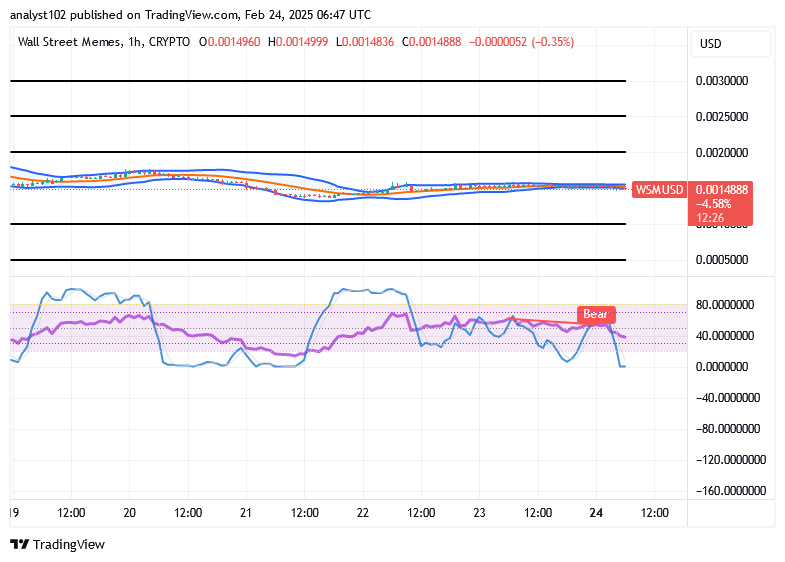
WSM/USD 1-hour chart
The 1-hour chart from the technical picture of the short-term setup showcases that the WSM/USD market holds on, conjecturing hikes in inputs.
The Bollinger Bands’ trend lines on the hourly chart are now converging, forming a tight trade zone, indicating indecisiveness in the market. Meanwhile, the stochastic oscillators have moved northward into the oversold region, signaling that the current price action is dominated by a weak bearish trend, with limited downward momentum.
Print money, you’re a criminal. Print trillions, you’re the central bank.
— Wall Street Memes (@wallstmemes) February 23, 2025
Buy and stake WSM now!: Wall Street Meme (WSM)