XRP (XRP/USDT) Eyes a Move Against the Tide
Estimated Reading Time: 3 minutes
Don’t invest unless you’re prepared to lose all the money you invest. This is a high-risk investment and you are unlikely to be protected if something goes wrong. Take 2 minutes to learn more
XRP Long-term Analysis: Ranging
The market for XRP against the Tether took a downturn after hitting above $2.2821 in the previous session. However, the pair has been dropping despite efforts to stabilize at different support zones.
Recently, the Guppy Multiple Moving Averages (GMMAs) on the chart suggest an impending bearish crossover as the set of EMAs converges. However, the positioning of the Stochastic RSI indicates selling pressure may be waning and XRP may be preparing for a northbound journey soon.
Currently, XRP trades at $2.1001, with increasing participants of about 600 million.
Technical Indicators
Major Resistance Levels: $2.2783, $2.2829, and $2.5000
Major Support Levels: $1.8600, $1.7495, and $1.6540
XRP Technical Analysis
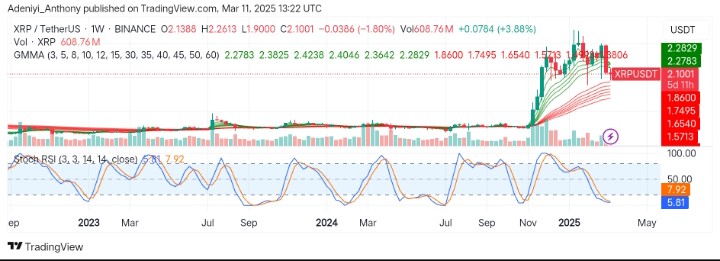
The analysis of XRP against the Tether on a weekly timeframe shows that the air is on a bearish episode as the short-period EMAs converge toward the long-period EMAs, the value of XRP lying in between. This suggests an impending crossover to the south, but more confirmation is needed.
However, the Stochastic RSI at the bottom indicates an oversold condition, attesting to the GMMA’s prediction but stating that selling pressure is waning as the lines prepare for a turn to the North.
To this end, the price needs to break above $2.2783 with an improved line to the North; otherwise, the price may consolidate further at this point for some time.
XRP/USDT Analysis: What’s Happening Here?
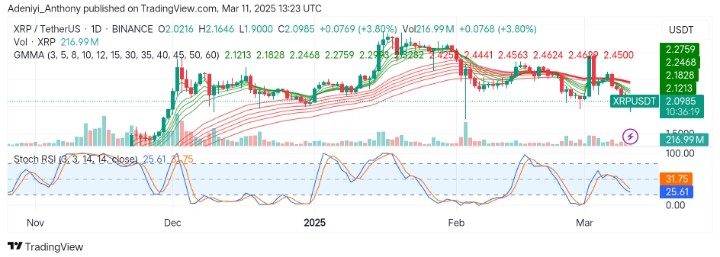
On the daily timeframe, XRP/USDT seems to advance to the North despite the bearishness that clouds the market. This indicates the bull’s resilience in pushing the price upward regardless of current market sentiment.
On the other hand, the Stochastic RSI signals current condition lacks conviction as lines point to the south, suggesting a significant amount of selling pressure still remains in the market.
To this end, more bullish participants are needed to push the price above $2.2759 with a move towards $2.4251. Conversely, a move below $2.050 would suggest a continued downtrend.
You can purchase crypto coins here. Buy LBlock