Helium (HNT/USD) Begins Recovery as Bulls Regain Momentum
Estimated Reading Time: 3 minutes
Don’t invest unless you’re prepared to lose all the money you invest. This is a high-risk investment and you are unlikely to be protected if something goes wrong. Take 2 minutes to learn more
The recent bearish trend in Helium (HNT/USD) found its bottom near the $2.10 level, following a sharp decline from a prolonged consolidation phase around the $4.00 mark. After stabilizing around the $2.00 zone, the market has initiated a bullish breakout, signaling the beginning of a recovery phase.
Currently, HNT/USD is trending upward and approaching the $4.00 resistance level once again. However, some profit-taking activity has emerged near the $3.50 level, causing a temporary pause in the rally as traders lock in short-term gains.
Helium (HNT/USD) Market Data
- HNT/USD Price Now: $3.48
- HNT/USD Market Cap: $65 million
- HNT/USD Circulating Supply: 185 million HNT
- HNT/USD Total Supply: 185 million HNT
- HNTENS/USD CoinMarketCap Ranking: #108
Key Levels
- Resistance: $4.00, $5.00, and $6.00
- Support: $2.50, $2.00, and $1.50
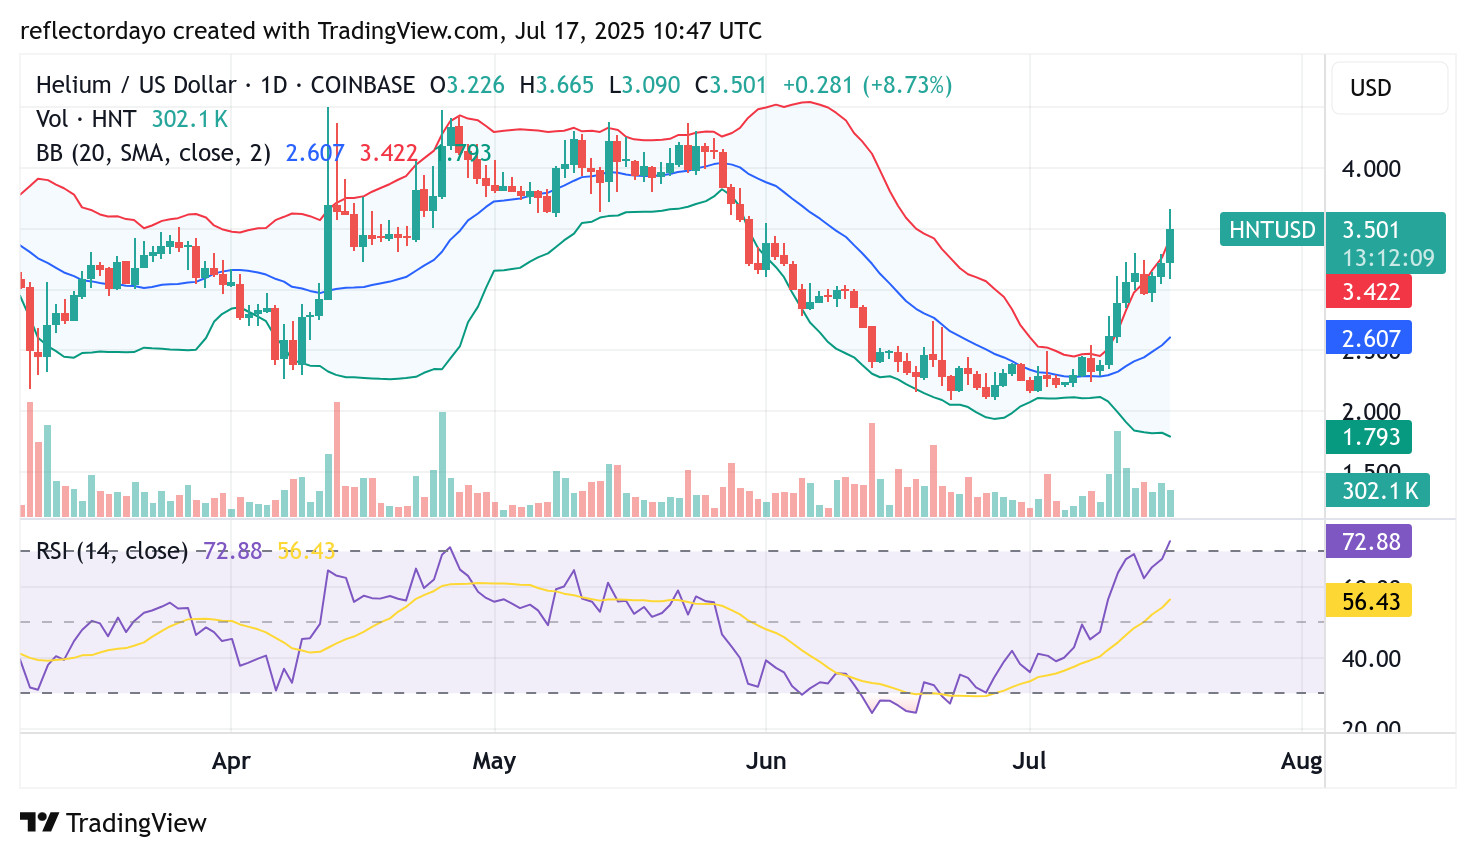
Helium (HNT/USD) Daily Chart Outlook: Signs of Bullish Continuation Amid Resistance at $3.50
Following the recent bearish trend that bottomed near the $2.00 price level, Helium (HNT/USD) entered a consolidation phase as bearish momentum faded and bullish sentiment gradually emerged. This consolidation lasted for nearly a month, reflecting a market caught in indecision.
The deadlock began to break around July 9, when bullish momentum resumed and the price started climbing in a recovery trend. The upward movement initially faced resistance at the $3.00 mark, where some bearish sentiment capitalized on market volatility. However, this resistance was short-lived.
In recent daily sessions, Helium has broken above this level and is now pushing toward the $4.00 price target. That said, a fresh wave of selling pressure has emerged at the $3.50 zone, causing a temporary pause in momentum. As seen in earlier resistance zones, a brief tug-of-war between buyers and sellers may play out at this level before the bullish trend continues toward the $4.00 threshold.
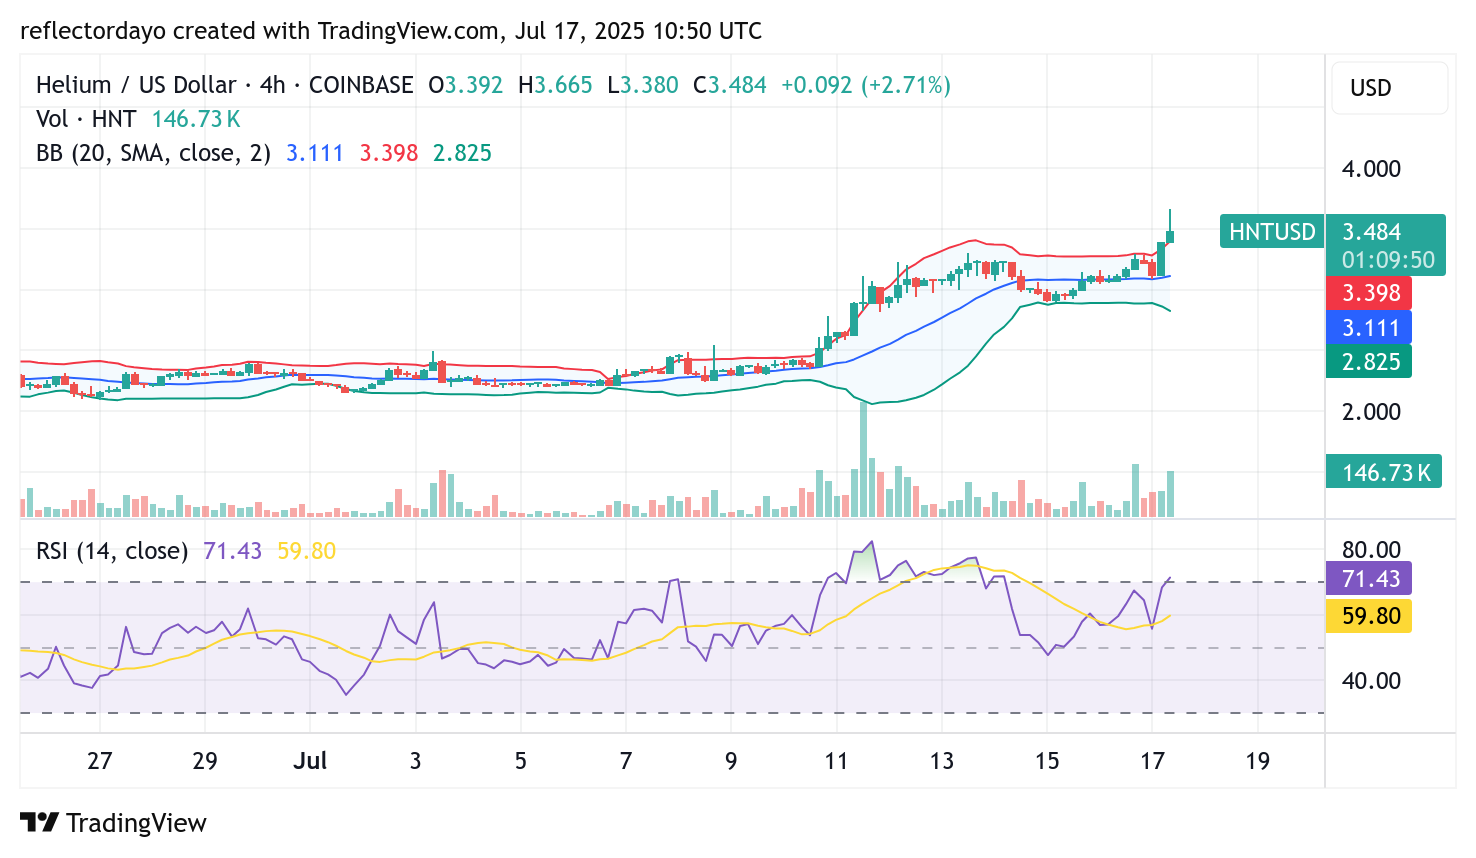
HNT/USD 4-Hour Chart Analysis: Bulls Target $4.00 Breakout as $3.50 Support Takes Shape
The HNT/USD market continues to show strong bullish momentum, backed by substantial trading volume and notable histogram activity that supports the ongoing upward movement. However, the latest candlestick pattern—marked by a prominent upper shadow—signals potential short-term exhaustion and hints at a possible correction.
According to the Bollinger Bands, the market is currently in overbought territory, which further supports the likelihood of a pullback, potentially below the $3.50 level. Despite this crypto signal, the sustained high trading volume suggests continued volatility, implying that significant price movement—either upward or downward—remains likely in the near term.