Bitcoin Cash (BCH/USD) Market Strives, Making a Recovery
Estimated Reading Time: 3 minutes
Don’t invest unless you’re prepared to lose all the money you invest. This is a high-risk investment and you are unlikely to be protected if something goes wrong. Take 2 minutes to learn more

Free Crypto Signals Channel
Bitcoin Cash Price Prediction – February 5
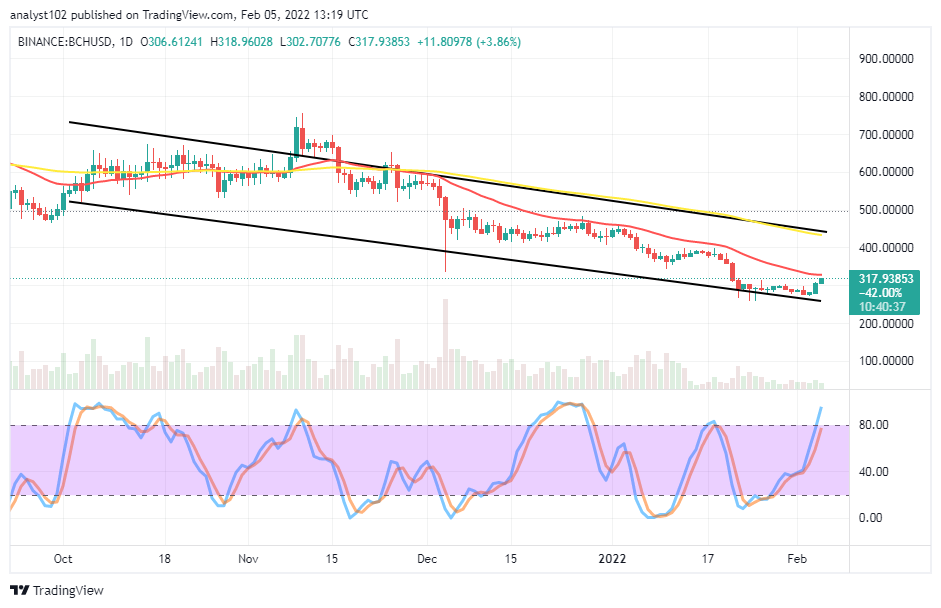
Currently, there are indications that the BCH/USD market strives, making a recovery motion after featuring a line of sequential lower lows recently. Price trades within the high and low of $318 and $302 at a positive percentage rate of 3.86 as of writing.
BCH/USD Market
Key Levels:
Resistance levels: $350, $400, $450
Support levels: $250, $200, $150
BCH/USD – Daily Chart
The BCH/USD daily chart showcases the crypto-economic market strives, making a recovery motion. The upper bearish channel trend line drew alongside the 50-day SMA indicator above the 14-day SMA indicator. A bullish candlestick is beefing up against the smaller SMA in an attempt to break out at it. The Stochastic Oscillators have moved into the overbought region, yet, pointing toward the north side that upward pressure is ongoing.
Will the BCH/USD market uphold its upward pushes as the crypto-economic market strives, making a recovery motion?
The BCH/USD trade may not uphold the current upward pushes for a long time as the crypto market strives, making a recovery motion. The positioning of the 14-day SMA closely above the bullish beefing candlestick signifies the possibility of seeing the crypto-economic price getting resisted in no time. Therefore, it may not be too safe for long-position takers to count upon any sudden fearful hiking at that capacity to avoid an unnecessary whipsawed trading situation.
On the downside of the technical analysis, the BCH/USD market short-position takers in the first place may have to exercise some patience by allowing a sell candlestick signal form at a higher trading spot before going for a launch of order afterward. The presumed scenario may be taking a while before observing until a line of smaller candlesticks formed, averaging the trend line of the 50-day SMA around $400.
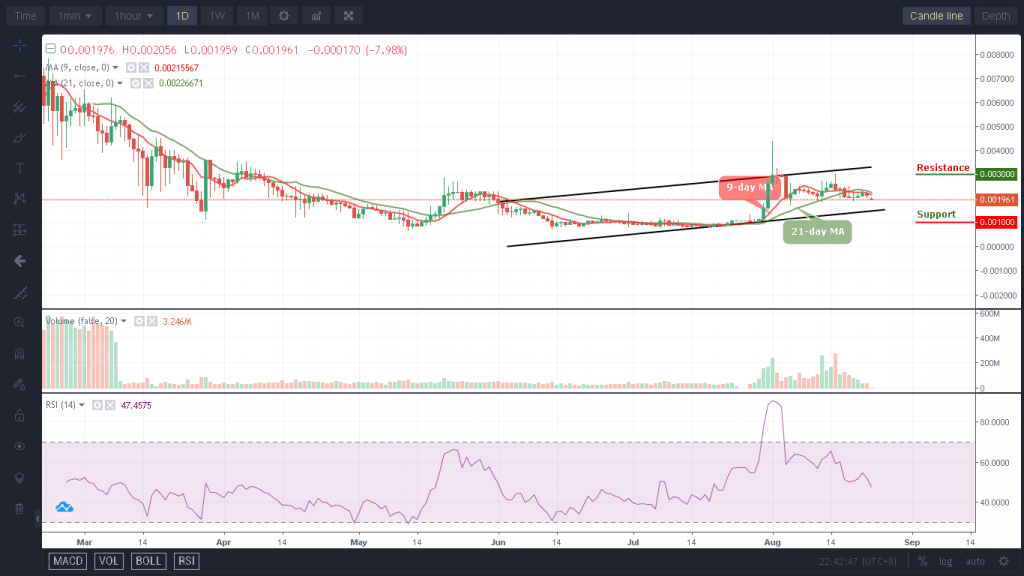
BCH/BTC Price Analysis
In comparison, Bitcoin Cash has had a bullish candlestick signaling a brighter trending force against Bitcoin, possibly in the subsequent operations. The cryptocurrency pair market strives, making a recovery attempt underneath the trend lines of the SMAs. The 14-day SMA indicator is beneath the 50-day SMA indicator. The Stochastic Oscillators have crossed their lines northbound briefly past the range of 40. And, with the emergence of a bullish candlestick in the making, the base crypto appears to have a better chance to garner more momentums against its flagship countering crypto in the following operations.
Note: Cryptosignals.org is not a financial advisor. Do your research before investing your funds in any financial asset or presented product or event. We are not responsible for your investing results.
You can purchase crypto coins here. Buy Tokens