Fetch.AI (FETUSD) Bulls Are Furious; The Price Skyrockets
Estimated Reading Time: 2 minutes
Don’t invest unless you’re prepared to lose all the money you invest. This is a high-risk investment and you are unlikely to be protected if something goes wrong. Take 2 minutes to learn more
The Fetch.ai market has had a number of long-term gridlock trends. But in the new year, the tide is turning in favor of the bulls as the price of FETUSD takes off in an upward direction. The bulls are very aggressive, and the momentum increases gradually. However, with this type of bull market behavior, there is the likelihood that the bear market may also respond accordingly, thereby widening the distance between support and resistance.
FET/USD Price Statistic
- FET/USD price now: $0.54
- FET/USD market cap: $437,353,813
- FET/USD circulating supply: 818,912,300 FET
- FET/USD total supply: 1,152,997,575 FET
- FET/USD coin market cap rank: #95
Key Levels
- Resistance: $6.0, $6.5, $7.0
- Support: $3.0, $2.5, $2.0
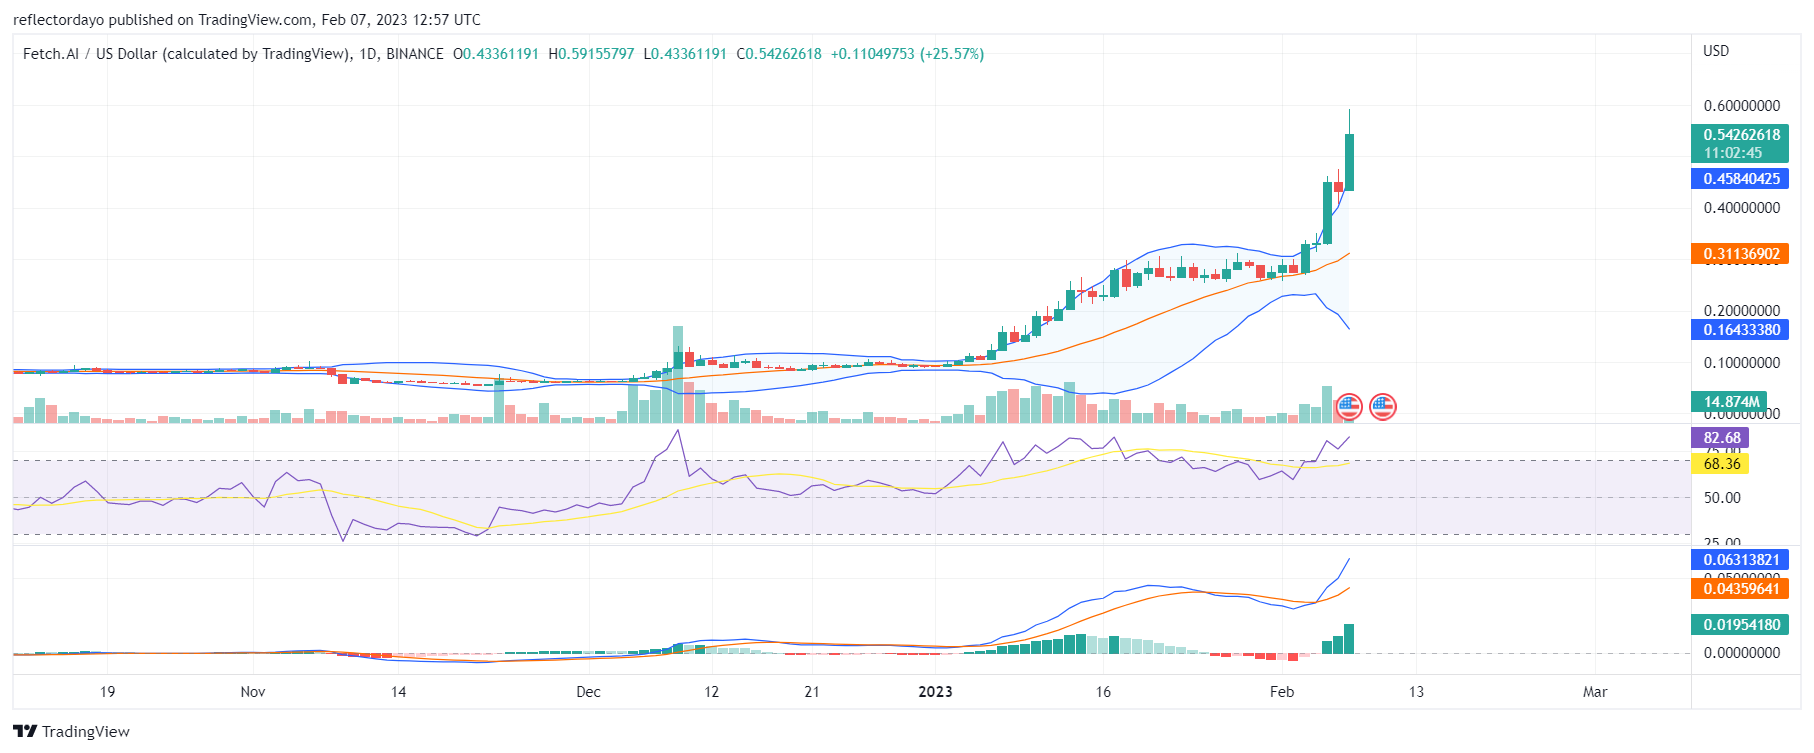
Price Prediction for Fetch.ai: A look at the Indicators
As the bullish price increases, the market’s volatility also increases. At this time, investors will want to proceed with a bit of caution. In the Bollinger band indicator, the upper band strongly ascends, trying to catch up with the price action. The 20-day moving average also follows along with the upper band. However, the lower band of the indicator diverges in the opposite direction. And this divergence seems just as strong as the movement or the upper band. Furthermore, the volume of trade lacks corresponding activities to back up the super bullish price activities. There is the likelihood that exhaustion may set in on the part of the bulls.
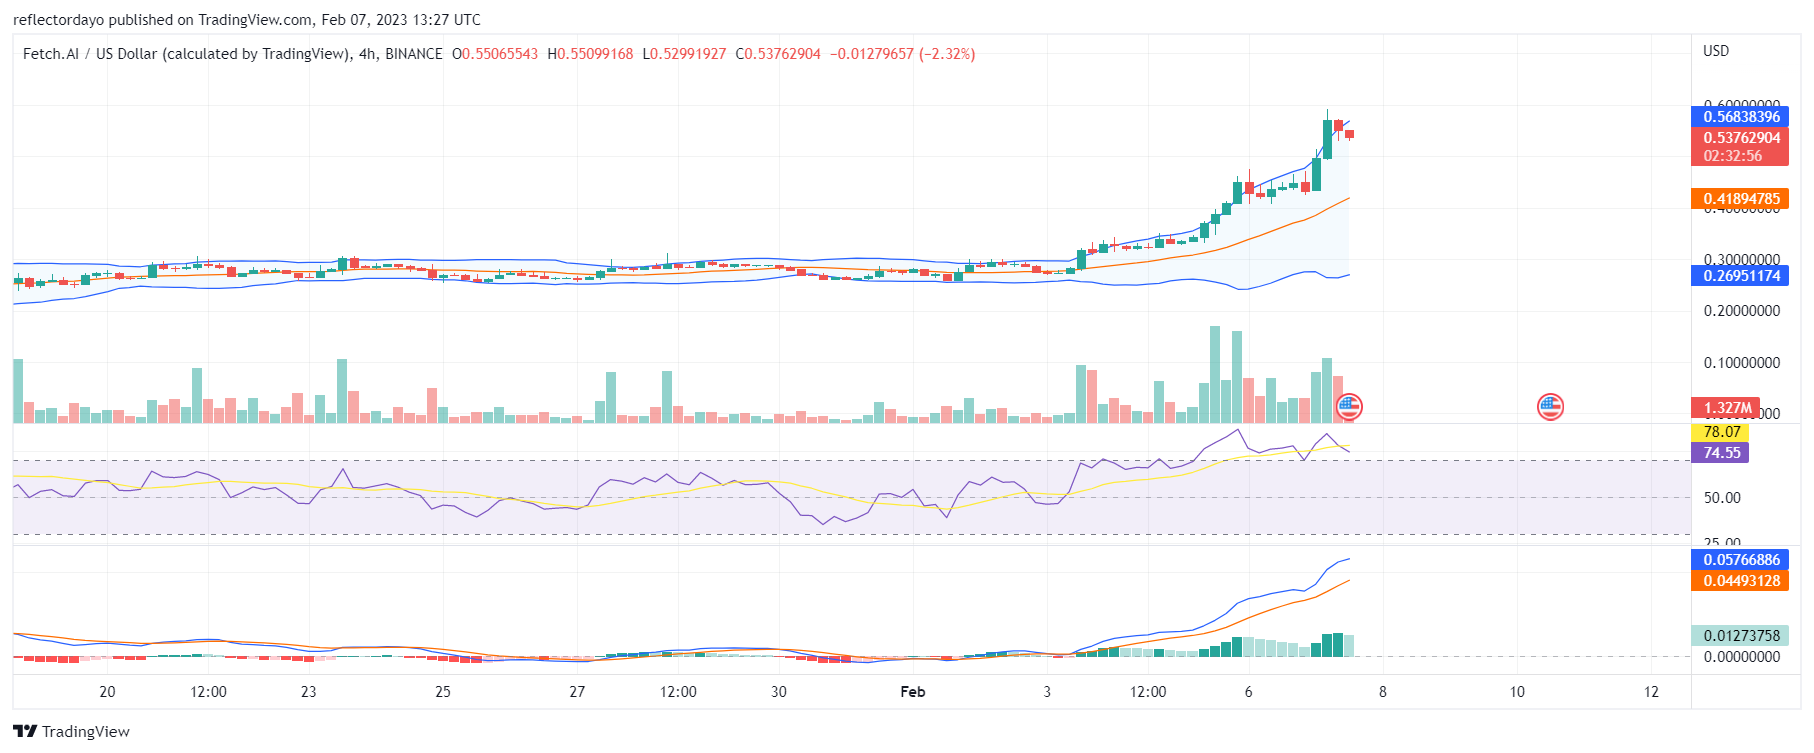
FET/USD 4-Hour Chart Outlook
The indicators are now showing signs of a price reversal. After the market hit the $0.6 resistance level, the bears seem to have been slowly driving the price back to the downside. The RSI line is reversing and so is the MACD line. However, there is a chance that the bull will stabilize the market by finding a support level above the $0.5 price level. When that happens, the bulls will drag the bears along with them to the upside. And the Bollinger bands may move upward with widened bands as the market continues to be volatile.