UMA (UMAUSD) Is Struggling to Climb Above the $1.890 Former Support Level
Estimated Reading Time: 2 minutes
Don’t invest unless you’re prepared to lose all the money you invest. This is a high-risk investment and you are unlikely to be protected if something goes wrong. Take 2 minutes to learn more
UMA Analysis – The Coin Is Struggling to Regain Its Place Above $1.890
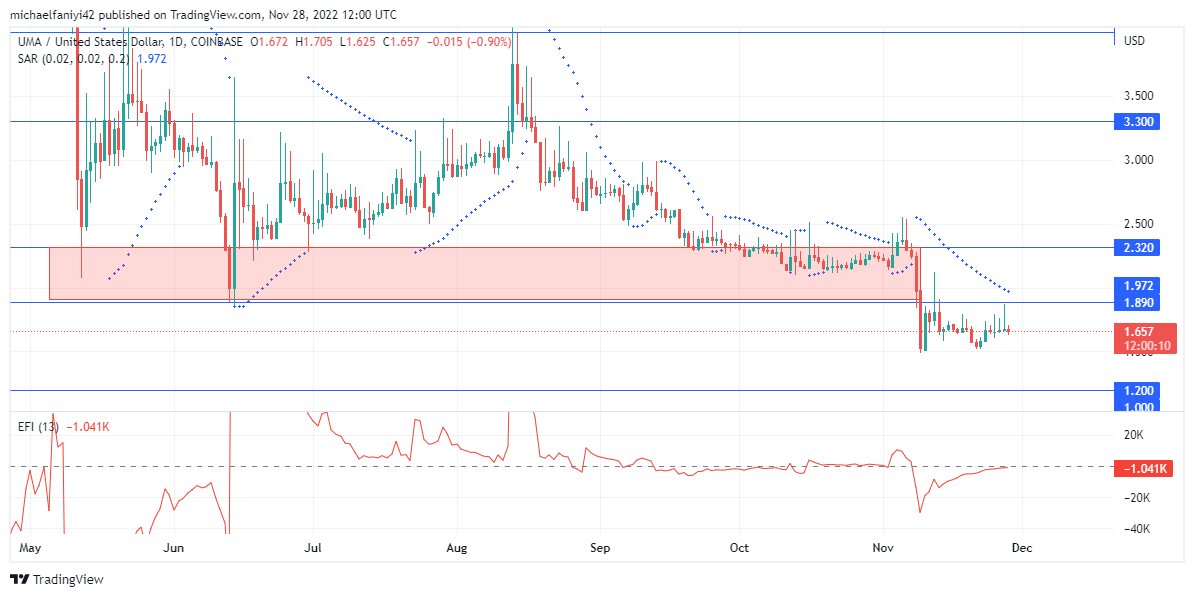
UMA is struggling to regain its position above the $1.890 significant level. The coin has spent much of this year relying on the support of the $1.890 significant level, which has now risen to $2.320. At some point, the market tried to structure itself into a bullish shape, hoping to spring up from this support level, but the move broke down at the last. This results in a further drop below the support level.
UMA Critical Levels
Resistance Levels: $1.890, $2.320
Support Levels: $1.200, $1.000
The price crashed to around $2.320 in May this year. Though the pressure from the downward force remains overbearing, the market could still make occasional intrusions to break the bearish trend. However, the price was severely restricted to $4.000. After a while, the buyers were too weak to even make the occasional intrusion.
Since the buyers further weakened, the sellers were allowed to push the market down until it dropped below the strong support level of $2.320. Currently, UMAUSD is now struggling to regain its position back above the support level. The Parabolic SAR (Stop and Reverse) dots on the daily chart are strongly aligned above the candles. The Elders Force Index (EFI) is currently negative. Nevertheless, it is currently thrusting upward to get to a positive position.
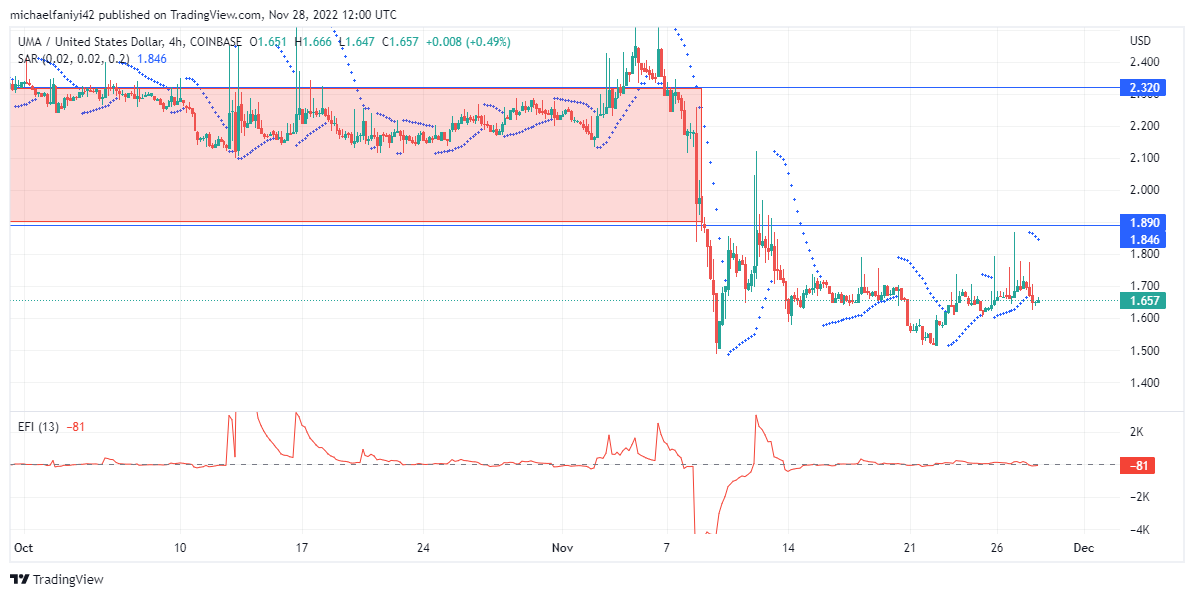
Market Expectations
The 4-hour chart highlights the struggles the price is going through. The market is currently trading sideways below $1.890, which has turned resistance. The EFI power line is seen undulating around the equilibrium level, while the Parabolic SAR dots are also alternating around the candles. UMA is currently struggling to regain its position and may drop as low as $1.200.
You can purchase Lucky Block here. Buy LBLOCK
Note: Cryptosignals.org is not a financial advisor. Do your research before investing your funds in any financial asset or presented product or event. We are not responsible for your investing results.