Polygon (MATIC/USD) Claims a New Higher Support Level
Estimated Reading Time: 3 minutes
Don’t invest unless you’re prepared to lose all the money you invest. This is a high-risk investment and you are unlikely to be protected if something goes wrong. Take 2 minutes to learn more
Since reaching a peak of $0.886 in mid-July, bearish sentiment has exerted considerable influence, persistently encroaching into what was previously bullish territory. Notably, around the $0.550 price level, the bulls have found a solid footing, leading to a consolidation phase lasting for a period.
In September, mounting selling pressure compelled the bulls to regroup around the $0.500 mark, marking the point from which the recovery journey commenced.
October appears to hold promise for bullish sentiments within the Polygon market. The first day of the month exhibited a robust upward price movement, with bulls successfully maintaining prices at a higher support level. This development has bestowed a competitive advantage on the bull market, potentially propelling the market further along an upward trajectory.
Polygon (MATIC) Market Data
- MATIC/USD Price Now: $0.567
- MATIC/USD Market Cap: $5,264,643,059
- MATIC/USD Circulating Supply: 9,299,803,031 MATIC
- MATIC/USD Total Supply: 10,000,000,000 MATIC
- MATIC/USD CoinMarketCap Ranking: #13
Key Levels
- Resistance: $0.600, $0.650, and $0.700.
- Support: $0.500, $0.450, and $0.400.
Price Prediction for Polygon: The Indicators’ Point of View
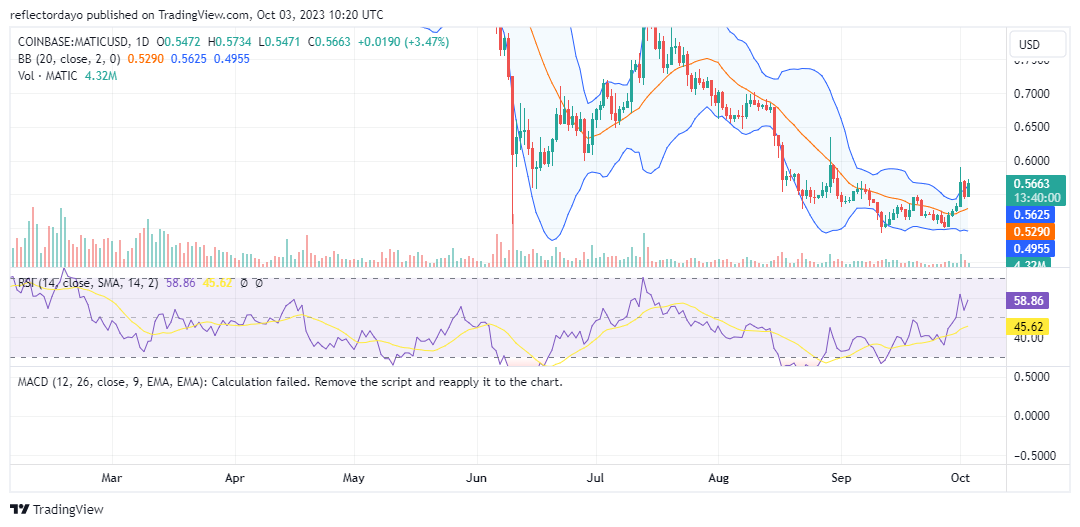
On October 1st, the Polygon market experienced a sudden and pronounced bullish surge during the daily trading session, propelling it beyond the upper boundary of the Bollinger Bands indicator. This rapid ascent signified that, in a relatively short period, increased buying interest had pushed the market into overbought territory. This development suggests a potential lack of sustainability in the bullish movement. Nevertheless, the bulls managed to maintain market stability around the $0.550 price level, demonstrating their continued presence.
Furthermore, the upper Bollinger Band has now aligned closely with the prevailing price action. This convergence suggests that the market may be tracing a path toward revisiting the high observed on August 29th, which was at $0.645.
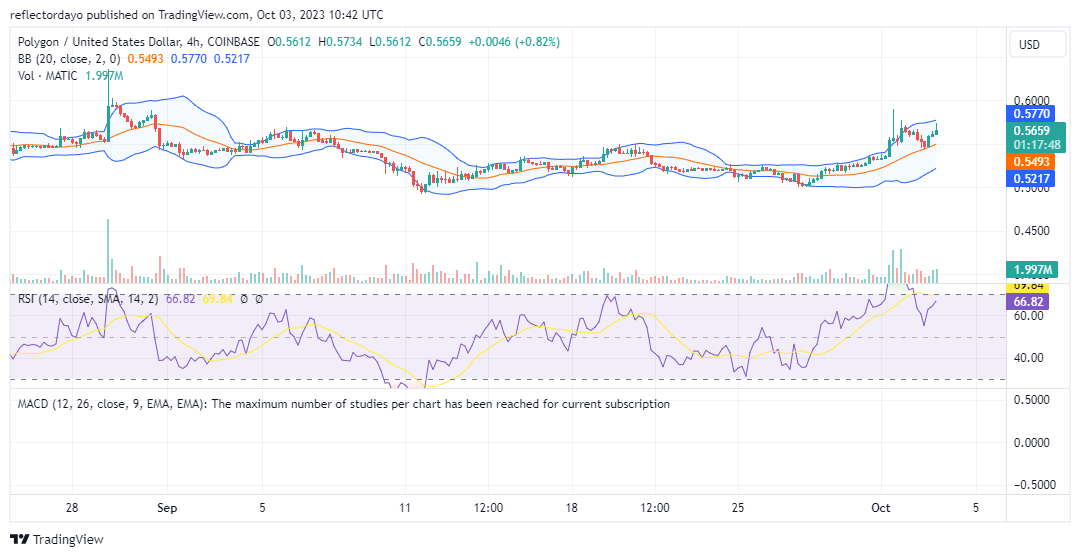
MATIC/USD 4-Hour Chart Outlook
From the 4-hour chart perspective of the market, it becomes evident that there is a growing upward momentum, despite encountering resistance at the $0.566 level. Recent market activity has been testing above this resistance level, signaling the potential for a breakout.
Several factors support the expectation of continued upward movement. Firstly, the trading volume indicates significant activity within the market, underscoring the heightened interest. Additionally, the price action has consistently remained above the 20-day moving average, reinforcing the bullish sentiment.
With these indicators in mind, the next notable target for the market could potentially be the $0.600 price level.