Ethereum (ETH/USD) Market Hits Resistance Averaging $2,500
Estimated Reading Time: 3 minutes
Don’t invest unless you’re prepared to lose all the money you invest. This is a high-risk investment and you are unlikely to be protected if something goes wrong. Take 2 minutes to learn more
Ethereum Price Prediction – July 5
The ETH/USD market hits resistance while averaging the level of $2,500 to now trade around the value of $2,208. The crypto economy’s percentage rate stands at about -4.92 as of writing.
ETH/USD Market
Key Levels:
Resistance levels: $2,500, $3,000, $3,500
Support levels: $2,000, $1,800, $1,600
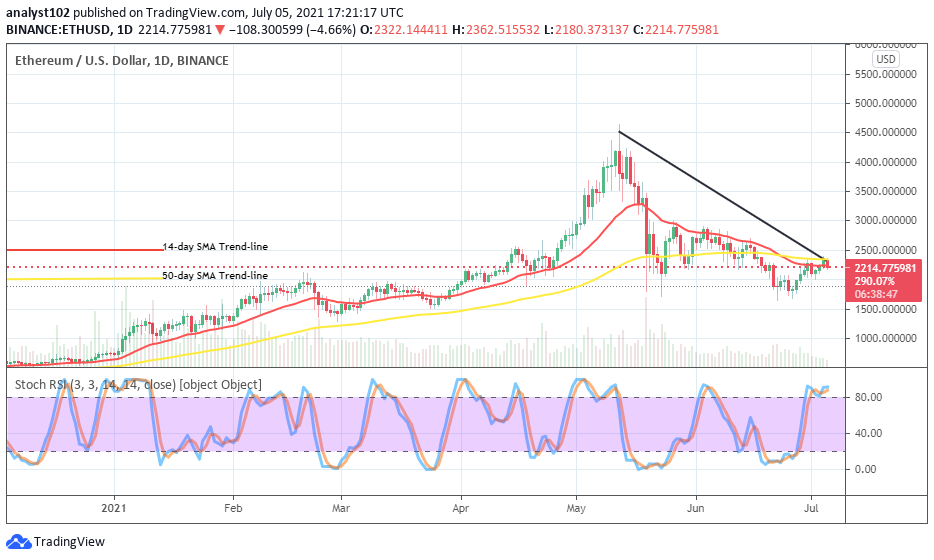
ETH/USD – Daily Chart
The ETH/USD daily chart now reveals that the crypto market hits resistance while averaging the level of $2,500 at the early hour of today’s session. The downward force hasn’t heightened until now as a bearish candlestick is forming to back it. There is an interception between the two SMAs as they are in the levels of $2,500 and $2,000. The 50-day SMA indicator is over the 14-day SMA indicator as the bearish trend-line drew southward to touch the bigger SMA at the buy signal side, placing a resistant mark. The Stochastic Oscillators are in the overbought region, now seemingly consolidating in it to probably suggest that a pull-up in the market has to pull down in the next session.
Will the ETH/USD operation go down further as the market hits resistance averaging $2,500?
There is every possibility that the ETH/USD go down further as the crypto market hits resistance, averaging a value of $2,500 during the early hour session of today. There is a tendency that bulls will relax more in the market to allow a better decent-repositioning of their stances at a later period while price actively and positively responds to downward forces that may come in a smaller-successive order.
It is depicted on the ETH/BTC price analysis chart currently that the base crypto is regaining trending weight against the counter crypto in a relatively moving manner. The smaller SMA has a line of smaller candlesticks close above its buy signal side. The 50-day SMA indicator is underneath the 14-day SMA trend-line. The Stochastic Oscillators are in the overbought region, denoting that the base crypto’s trending capacity pairing with that of the flagship counter crypto’s has to debase at a later session.
ETH/BTC Price Analysis
It is depicted on the ETH/BTC price analysis chart currently that the base crypto is regaining trending weight against the counter crypto in a relatively moving manner. The smaller SMA has a line of smaller candlesticks close above its buy signal side. The 50-day SMA indicator is underneath the 14-day SMA trend-line. The Stochastic Oscillators are in the overbought region, denoting that the base crypto’s trending capacity pairing with that of the flagship counter crypto’s has to debase at a later session.
Note: new.cryptosignals.org is not a financial advisor. Do your research before investing your funds in any financial asset or presented product or event. We are not responsible for your investing results.
You can purchase crypto coins here. Buy Tokens