The DYDX Market (DYDX/USD) Stretches Towards Late August High
Estimated Reading Time: 3 minutes
Don’t invest unless you’re prepared to lose all the money you invest. This is a high-risk investment and you are unlikely to be protected if something goes wrong. Take 2 minutes to learn more
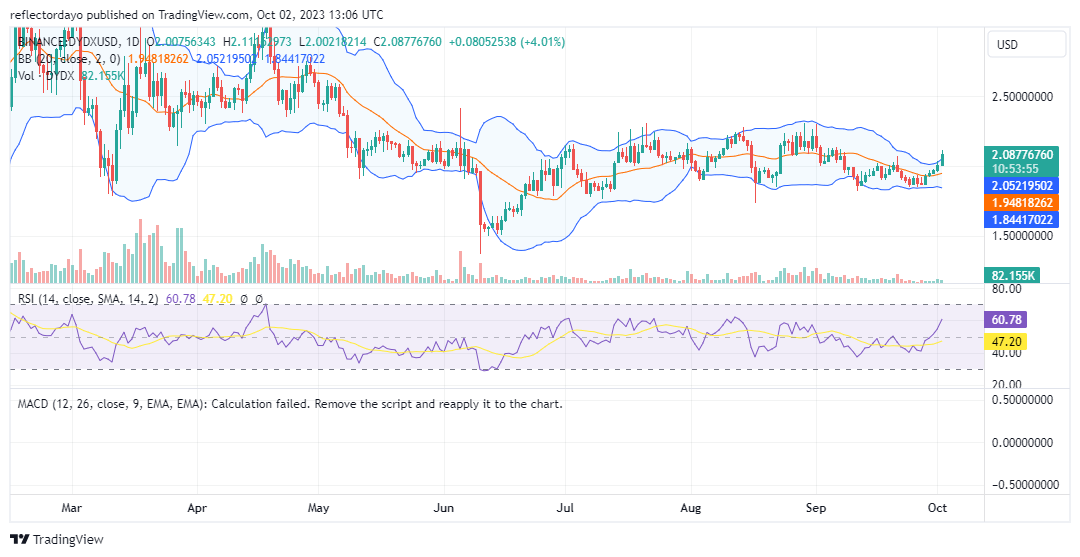
As the DYDX market ushers in the new month, prices have initiated an upward trajectory. The candlestick patterns observed since September 28th reflect a notably bullish market sentiment. During the preceding daily trading session, the DYDX market successfully breached the $2.00 resistance threshold. This bullish momentum persists in today’s market, with prices reaching towards $2.3083, a level last seen in late August, which also represents a key resistance level.
DYDX Market Data
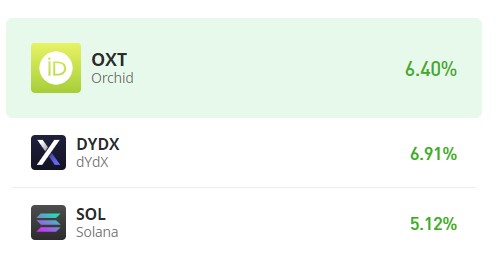
- DYDX/USD Price Now: $2.0958
- DYDX/USD Market Cap: $380,635,203
- DYDX/USD Circulating Supply: 183,765,523 DYDX
- DYDX/USD Total Supply: 1,000,000,000 DYDX
- DYDX/USD CoinMarketCap Ranking: #84
Key Levels
- Resistance: $2.300, $2.500, and $2.700.
- Support: $1.800, $1.700, and $1.650.
Price Prediction for the DYDX Market: The Indicators’ Point of View
The Relative Strength Index (RSI) currently indicates robust buying momentum, with a reading of approximately 61.23. This reading suggests that the DYDX market continues to exhibit bullish potential. The combined insights from the RSI and the daily chart provide compelling reasons for traders to consider entering the bull market.
However, upon closer examination of the Bollinger Bands, it becomes evident that the bullish movement has had a limited impact on these bands. The upper standard deviation curve has not exhibited a strong response to the bullish trend, resulting in one-sided volatility primarily within the bull market. Furthermore, the observed trading volume appears to be relatively low, which raises concerns about the sustainability of the bullish candle formations. Traders should exercise caution given the low trading volume.
It’s worth noting that the ongoing bull market may be driven by influential traders aiming to attract additional participants. This strategy has the potential to yield positive results.
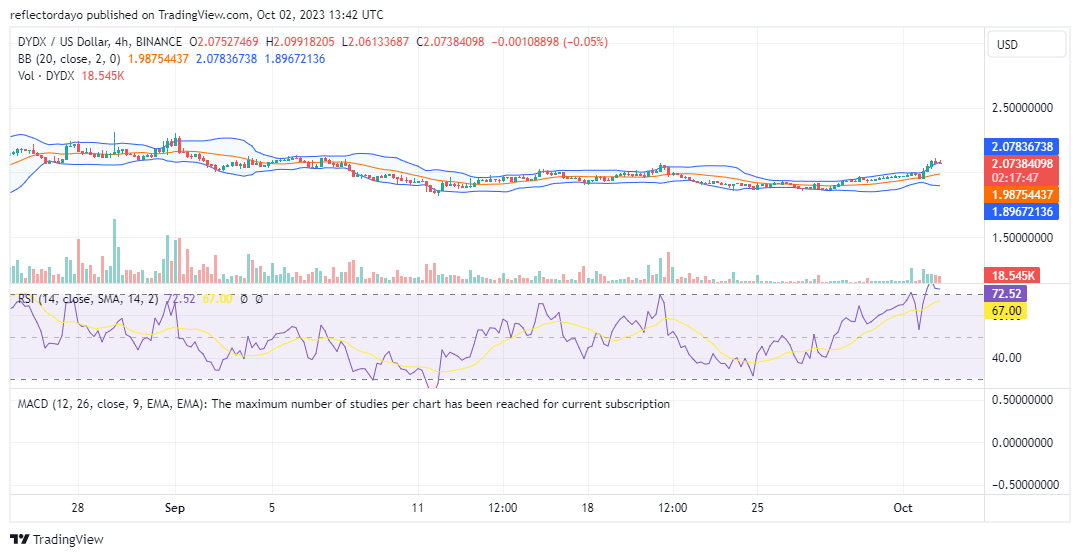
DYDX/USD 4-Hour Chart Outlook
Unlike the daily chart, the 4-hour chart provides a more favorable perspective on trading volume, bolstering the case for the ongoing price upswing. Consequently, traders who prioritize the 4-hour chart can approach the bullish trend with greater confidence, as the volume of trade aligns with market dynamics. Nevertheless, it’s worth noting that the DYDX market may have encountered resistance around the $2.0714 price level, leading to a potential retracement.