Bitcoin (BTC/USD) Dumps Lower Averaging the Support of $35,000
Estimated Reading Time: 3 minutes
Don’t invest unless you’re prepared to lose all the money you invest. This is a high-risk investment and you are unlikely to be protected if something goes wrong. Take 2 minutes to learn more
Bitcoin Price Prediction – May 16
The market valuation of BTC/USD goes under a falling pressure after losing momentum near underneath the resistance trading zone of $60,000. The crypto’s price now trades around the value of $49,466 with about a 5.44% increase.
BTC/USD Market
Key Levels:
Resistance levels: $55,000, $60,000, $65,000,
Support levels: $35,000, $30,000, $25,000
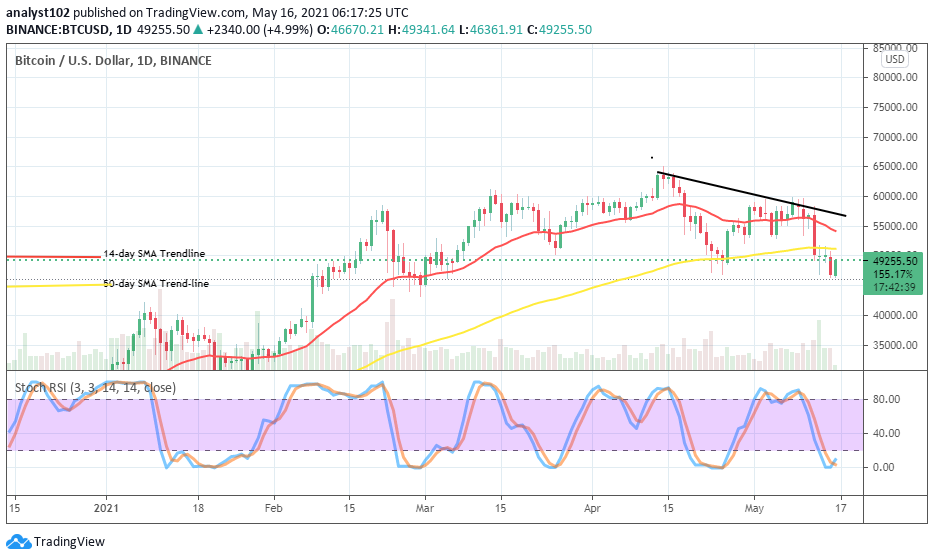
BTC/USD – Daily Chart
After a series of variant candlesticks characterized by higher lows underneath the resistance level of $60, a long bearish eventually emerged on May 12th day’s session. And, that later on led the market direction downward to average the support line of $35,000 on May 15. A formation of a bullish candlestick is in the making presently to suggest the crypto’s possibility of recovery soon. The 14-day SMA trend-line has a bit bent towards the south over the 50-day SMA indicator. The Stochastic Oscillators are dipped into the oversold region trying to point back upwardly to indicate the potential gaining of upsides soon by the chief crypto as traded against the worth of the US Dollar.
What could the BTC/USD market’s action around the $35,000 support?
It now appears that the support level of $35,000 will have to serve as a critical support line as the BTC/USD bulls are expected to make use of it as a baseline trading zone to muster the energy. A breakdown of it may make it trading situation uglier for a return of uptrend. But, in the meantime, with that support line earlier mentioned now getting involved in the analysis; a breakout of the 50-day SMA indicator at the point Of $50,000 is now needed for a better bullish signal confirmation return in the market.
On the account of a contrary note to the upside analysis, in the first place, a further breakdown of a support line at $35,000 is greatly liable to cause a build of caging trading moment against bears below that point. Therefore, sell orders need to be suspended. The Stochastic Oscillators as in the oversold region have indicated that bears may lack the capacity to hold the crypto’s value lowly under it for a long time.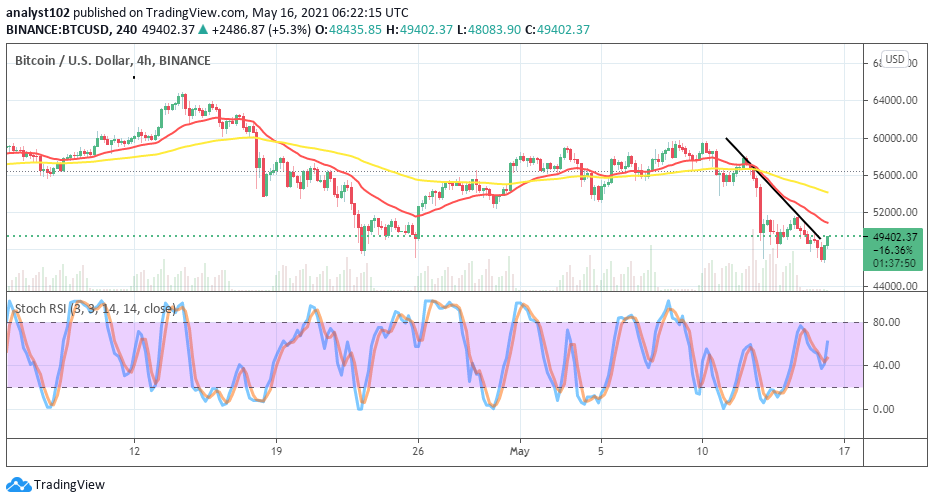
BTC/USD 4-hour Chart
On the medium-term chart, On May 12, a bearish candlestick occurred to break down away from the value of $56,000 to depict a clearer bearish trend of the BTC/USD market currently. The 50-day SMA indicator has been intercepted by the 14-day SMA trend-line from the top. The bearish trend-line drew across the two SMAs down to the lower trading zone of the market. The Stochastic Oscillators have now crossed back to point northward within the ranges of 40 and 80. That now indicates that the crypto is recuperating on a gradual note against the counter-fiat US currency. Therefore, intending investors may now consider joining the crypto-trade.
Note: cryptosignals.org is not a financial advisor. Do your research before investing your funds in any financial asset or presented product or event. We are not responsible for your investing results.