Lucky Block Price Prediction: LBLOCK/USD Becomes so Cheap; Buyers Prepare for a fresh Uptrend
Estimated Reading Time: 2 minutes
Don’t invest unless you’re prepared to lose all the money you invest. This is a high-risk investment and you are unlikely to be protected if something goes wrong. Take 2 minutes to learn more

Free Crypto Signals Channel
Lucky Block Price Prediction – September 28
The Lucky Block price prediction reveals that LBLOCK remains within the 9-day and 21-day moving averages as the price becomes cheaper.
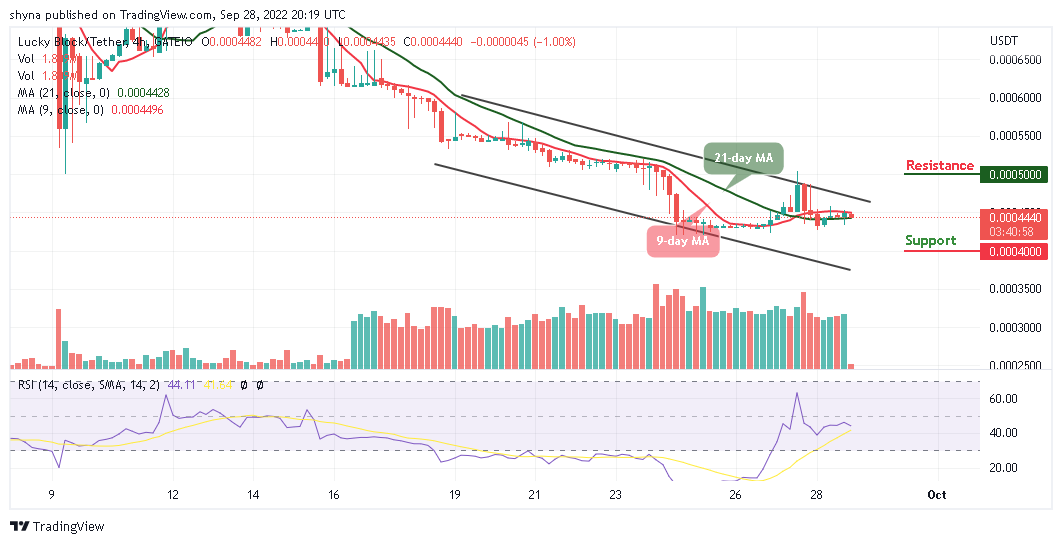
LBLOCK/USD Medium-term Trend: Bearish (4H Chart)
Key Levels:
Resistance levels: $0.00050, $0.00052, $0.00054
Support levels: $0.00040, $0.00038, $0.00036
LBLOCK/USD is ranging as buyers prepare the market for a fresh uptrend. However, it appears that the selling pressure may continue as the crypto faces rejection at the high of $0.0004490. However, if the sellers push the market further lower, bears can expect immediate support to be located below the 9-day moving average.
Lucky Block Price Prediction: LBLOCK/USD Will Head for a Retracement
The Lucky Block price will cross above the 9-day moving average and head toward the upper boundary of the channel as the coin prepares for the bullish movement, however, the current movement will be a good opportunity for the existing buyers to buy the dip. Moreover, the technical indicator Relative Strength Index (14) moves below the 50-level and it could reach the supports at $0.00040, $0.00038, and $0.00036.
On the other hand, if the buyers hold the current market value and push it towards the upper boundary of the channel, a break above this barrier can hit the resistance levels at $0.00050, $0.00052, and $0.00054 respectively.
LBLOCK/USD Medium-term Trend: Ranging (1H Chart)
According to the 1-hour chart, the Lucky Block (LBLOCK) is moving around the 9-day and 21-day moving averages as the coin moves in the same direction, which could give the new and existing buyers to buy more.
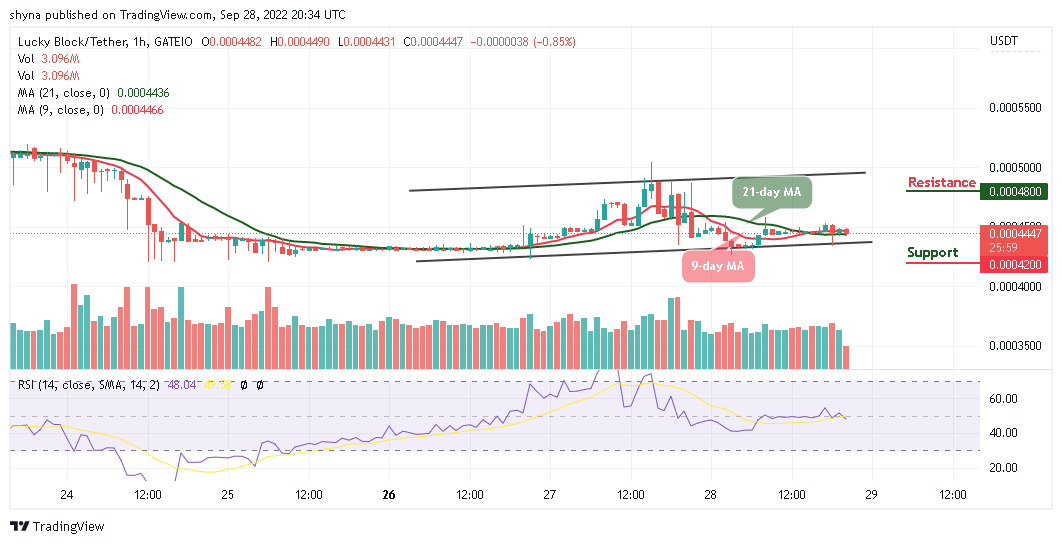
From above, higher resistance could be located at $0.00048 and above but, any bearish movement below the lower boundary of the channel could hit the support level at $0.00042 and below while the technical indicator Relative Strength Index (14) moves below the 50-level.
You can purchase Lucky Block here. Buy LBLOCK