Cardano (ADA/USDT) Eyes Potential Upside Breakout Ahead
Estimated Reading Time: 3 minutes
Don’t invest unless you’re prepared to lose all the money you invest. This is a high-risk investment and you are unlikely to be protected if something goes wrong. Take 2 minutes to learn more
Cardano Weekly Analysis: Bullish
The market for Cardano against Tether has shown some promising signs of a bullish trend recently, as demonstrated by the participation and increased momentum.
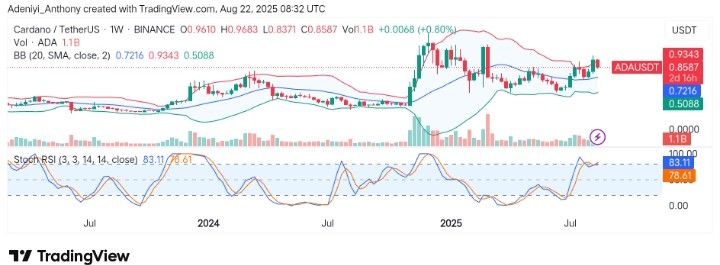
Currently, Cardano is fluctuating within the boundaries of the Bollinger Bands, recording a massive move above the $1.00 level before correcting to the $0.85 level. Also, the Stochastic RSI appears to be oversold, suggesting an impending downward movement for the pair. However, considering the current participation level, the price might override the possibility of further correction before testing a higher resistance level.
Currently, Cardano trades at $0.8587 with a massive 1.1 billion traded volume for the week.
Technical Indicators
Major Resistance Levels: $0.9343, $1.0000, and $1.2000
Major Support Levels: $0.8000, $0.7126, and $0.58000
Cardano Technical Analysis
On the weekly timeframe, Cardano against Tether seems to be at a critical point, trying to create a base above the current level so as to test $0.9343 for further upside movement. However, the price action around the upper boundary of the Bollinger Bands suggests a potential reversal on the way if the price fails to break through immediate resistance.
Also, the Stochastic oscillator at 83.11 indicates an overbought condition, typically indicating the pair may face a short-term pullback. To this end, with strong bullish participation, a break above the immediate resistance level would signal a further move to the north; otherwise, if the price fails to hold below the current level, sellers might push the price towards $0.7216.
Cardano Starting to Outperform Bitcoin
Cardano on the weekly timeframe appears to be on bullish divergence, forming a lower low on the main chart while the Stochastic shows the formation of higher lows. This analysis shows that the pair might surge massively to the upside very soon, as the daily chart displays same pattern.
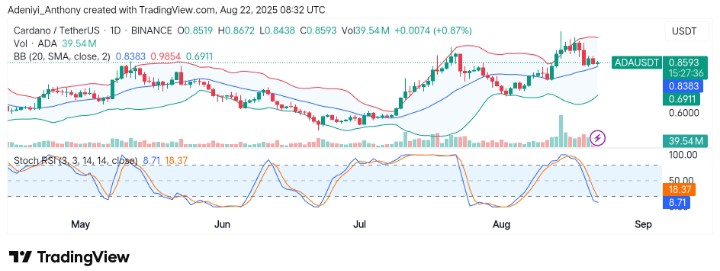
ADA/USDT Analysis: Holding Above $0.8593
On the daily chart, ADA/USDT is pulling back from recent highs. Support is forming near the dynamic boundary of the Bollinger Bands—a moving average-based volatility range. To this end, the price may move sideways before potentially making a significant move.
However, the momentum oscillator beneath the chart suggests the market in this timeframe is oversold, implying a possible upside reversal in the near term as the volume remains steady. To this end, a break beyond $0.8600 would indicate a bullish momentum towards higher levels.
You can purchase crypto coins here. Buy Crypto