Litecoin (LTC/USD) Price Is Building a Base at $90; It May Step Up Soon
Estimated Reading Time: 4 minutes
Don’t invest unless you’re prepared to lose all the money you invest. This is a high-risk investment and you are unlikely to be protected if something goes wrong. Take 2 minutes to learn more
Litecoin Price Prediction – July 19
The southward path to the downside in the Litecoin market operation against the US coin has now resumed to build a base at $90; it may step up soon off to the north side after leaving no room for any leftover declines that can still surface.
After applying some levels of patience toward getting active swings against the southerly direction before decent long-term position orders may be placed, the procedure for the predicted trade circumstance that would generate the forces back to the upside may be impending. As the lines of negotiation have been between $91.419868 and $94.232454, a minute positivity percentage rate has reached about 0.87. If sellers don’t forcefully consolidate past $90, their market conditions may whipsaw.
LTC/USD Market
Key Levels:
Resistance levels: $100, $110, $120
Support levels: $80, $75, $70
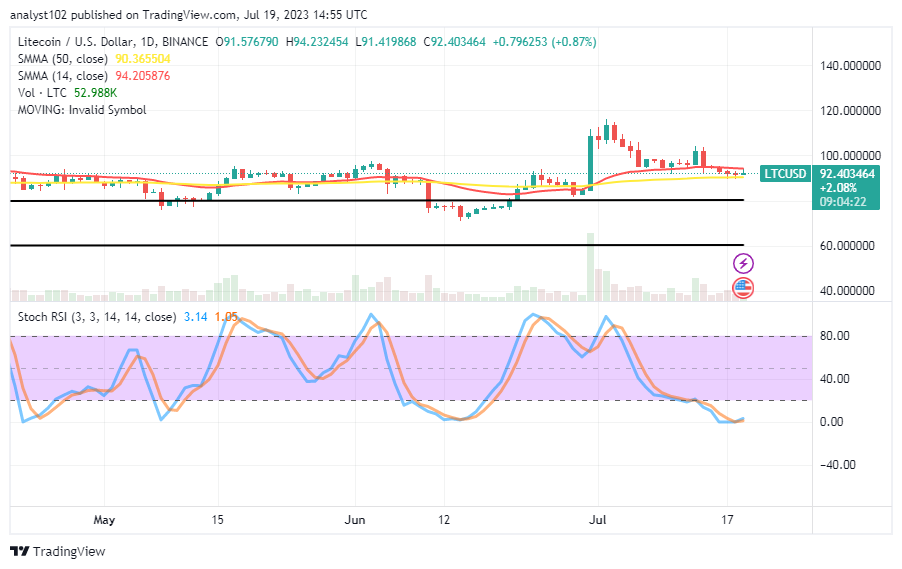
LTC/USD – Daily Chart
The LTC/USD daily chart reveals that the crypto price is building a base at $90, as it may step up soon to decimate some parts of the points back to the moon route.
Given that the 14-day SMA indicator is at $94.205876, just over the $90.365504 of the 50-day SMA indicator, and that some levels of trade capacity have been shown in the majority of the indicators, it is likely that a baseline will be established in the upcoming operations The Stochastic Oscillators have moved back downward into the oversold region to maintain levels from 1.05 to 3.14 briefly above the positive line.
What is the most probable direction that the LTC/USD market may take in the next few days?
From the technical point of view, at this time, there will likely be moments of witnessing a line of fluctuations around $90, as the LTC/USD market is building a base and may step up soon away from the value.
As most of the indicators have positioned themselves to state, the gravitational pressures on the reduction side of the $90 level lack the merit of pushing sustainably into a long-lowering path. A quick production of a bullish candlestick from this current point will therefore set up a stride to push over some resistances in the mode of recovery based on that feeling.
On the downside of the technical analysis, at this junction, bears in the LTC/USD market may only be pushing with a low-active motion around the $90 level, especially if bulls are to prolong moving up from the zone. Additionally, the prolonged presence of the sellers surrounding the value may have the impact of lowering the value by another $80 before quickly recovering the lost catalysts.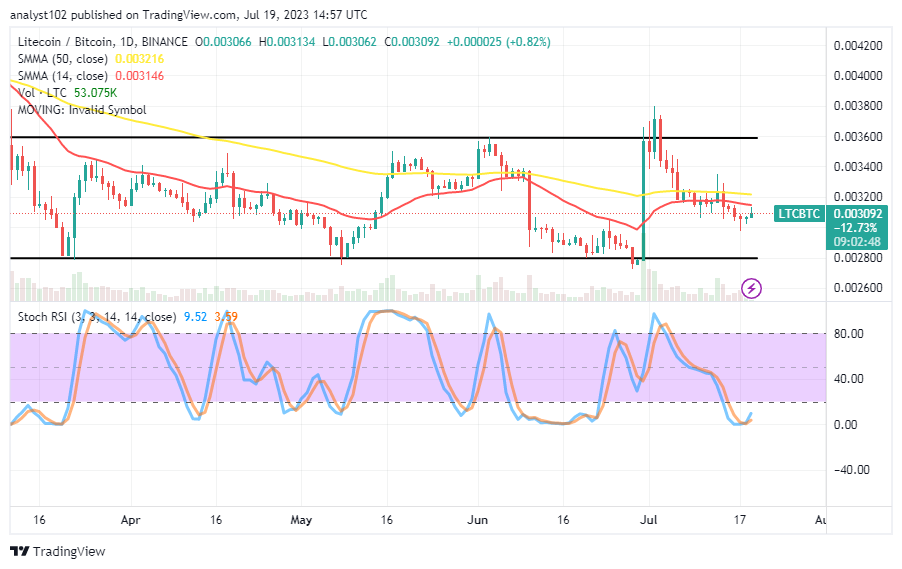
LTC/BTC Price Analysi
In contrast, Litecoin has been seen to be completing a drawback session against Bitcoin, as the price is building a base beneath the indicators’ trend lines, and it may step up soon away from the present trading zone.
The 14-day SMA indicator is underneath the 50-day SMA indicator. And they are not too far away, pointing toward the east. The Stochastic Oscillators have crossed northbound from 3.59 to 9.52 levels. It demonstrates how the core cryptocurrency economy is growing stronger and regaining some of the positions it lost to the counter-trading crypto instrument.
Note: Cryptosignals.org is not a financial advisor. Do your research before investing your funds in any financial asset or presented product or event. We are not responsible for your investing results.
You can purchase Lucky Block here. Buy LBLOCK