Litecoin (LTC/USD) Market Falls Favorably, Finding a Base Over $90
Estimated Reading Time: 4 minutes
Don’t invest unless you’re prepared to lose all the money you invest. This is a high-risk investment and you are unlikely to be protected if something goes wrong. Take 2 minutes to learn more
Litecoin Price Prediction – July 11
After the development of convergences at higher trading areas in the LTC/USD trade, a path has been formed in a descending motion, demonstrating that the crypto-economic market falls favorably, finding a base over the line of $90.
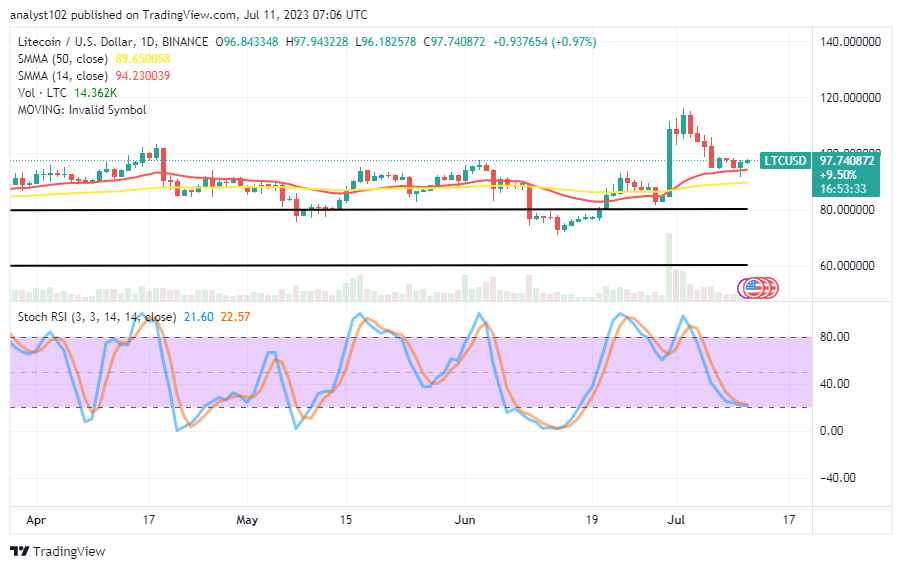
The velocity pace maintained by the LTC/USD trade sellers has been getting a reduction index over a couple of days to the extent of moving in the high and low range values of $97.943228 and $96.182578, keeping a minute positive percentage rate of 0.97. At this time of the technical analysis write-up, the moves supporting the pushes to the upside will remain firm against the motions that could run backward to cause long-term declines because we are gradually approaching the presumed bullish trending cycle.
LTC/USD Market
Key Levels:
Resistance levels: $110, $120, $130
Support levels: $85, $75, $65
LTC/USD – Daily Chart
The LTC/USD daily chart reveals that the crypto-economic market falls favorably, finding a base above the level of $90.
The 14-day SMA indicator is at $94.230039, above the $89.650058 value line of the 50-day SMA indicator. Variant candlesticks have been featured to showcase a range. The Stochastic Oscillators have traversed southbound from the overbought region, seemingly attempting to cross back to the north at 22.57 and 21.60 points. In the meantime, the movement appears to be getting ready to close the gap.
What is the probable propensity to shift base lower against the 14-day SMA in the transaction operations of the LTC/USD market?
At this moment, the stochastic variable indices in the market deals between Litecoin and the US coin suggest a lesser rate of seeing more lows if there will be more in the near future as the crypto price falls favorably, finding a base over the point of $90.
A closure technical trade view has opined that a point toward regaining a longing entry has built up around the trend line of the 14-day SMA, even though a chain of sideways sessions is relatively ongoing. Buyers might play alongside the closing proceeding of the Oscillators to the north by ensuring that a protective order is executed around the spot of $90 once they are triggering their positions.
On the downside of the technical analysis, the LTC/USD trade short-position takers might be riding decently if a candlestick pulls up over the smaller SMA and gets negation force to convert it to a falling mode against the bigger SMA at the lower supporting end. Then, there will be a chance of witnessing a line of lower lows in the long run.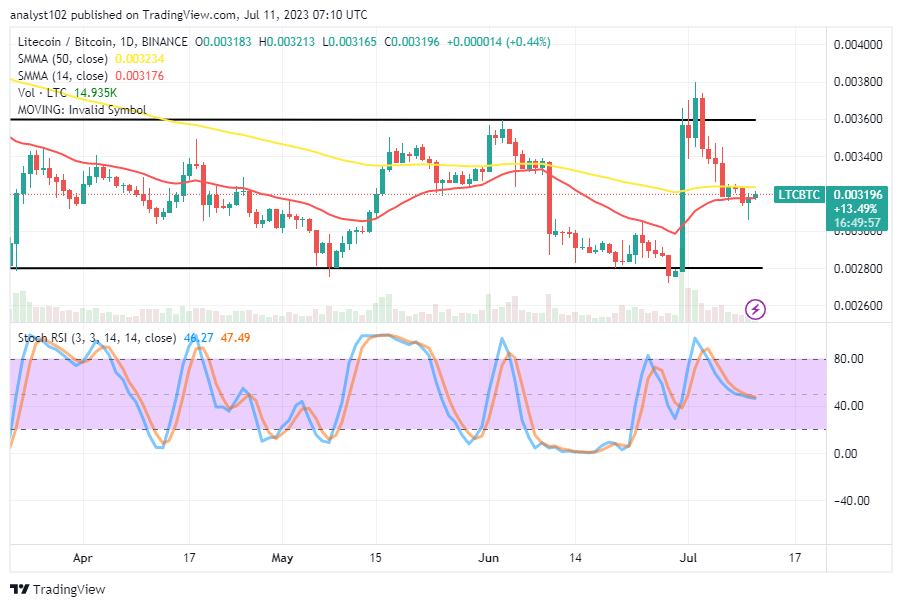
LTC/BTC Price Analysi
In contrast, Litecoin’s trending outlook against Bitcoin has fallen favorably, finding a base around the trend lines of the SMAs.
The 50-day SMA indicator has been placed closely over the 14-day SMA indicator. And they are both pointing in the eastward direction. The Stochastic Oscillators have diverged in direction from the overbought region to poise at 47.49 to 46.27 values. Yesterday’s session finished with a bottom shadow candlestick to give an insight that the base crypto will gain some signs of surging soon against the possibility of the counter crypto losing the momentum to press down more from this point in the following activities.
Note: Cryptosignals.org is not a financial advisor. Do your research before investing your funds in any financial asset or presented product or event. We are not responsible for your investing results.
You can purchase Lucky Block here. Buy LBLOCK