Arbitrum Price Prediction: ARB/USD Ranges Below $0.98 Support
Estimated Reading Time: 3 minutes
Don’t invest unless you’re prepared to lose all the money you invest. This is a high-risk investment and you are unlikely to be protected if something goes wrong. Take 2 minutes to learn more
Arbitrum Price Prediction – May 19
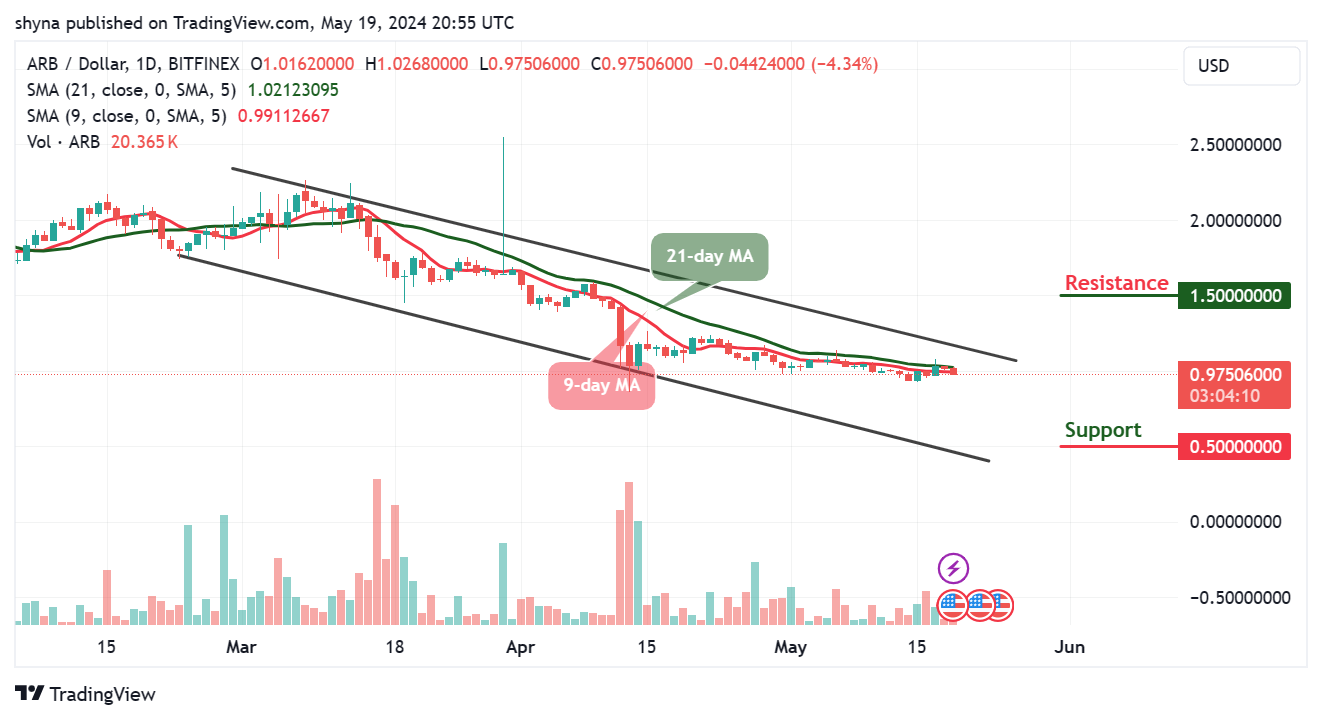
The Arbitrum price failed to cross above the resistance level of $1.02. As a result, ARB could begin a fresh decline.
ARB/USD Long-term Trend: Bearish (Daily Chart)
Key levels:
Resistance Levels: $1.50, $1.60, $1.70
Support Levels: $0.50, $0.40, $0.30

ARB/USD has been moving sideways for the past few days, selling pressure is likely to play out if the bears resume fully. However, today’s trading session has seen the Arbitrum price tumbled below the daily high of $1.02. Therefore, the coin could hit a low of $0.95 if heads toward the lower boundary of the channel.
Arbitrum Price Prediction: ARB Price Could see a Further Drop
The Arbitrum price may continue to follow a downward trend if the sellers increase the pressure. Meanwhile, with the Arbitrum price heading toward the south, the coin may likely create new support at $0.95. Moreover, the crypto market is hovering below the 9-day and 21-day moving averages. On the other hand, if the Arbitrum price crosses above the upper boundary of the channel, it could locate the potential resistance at $1.50, $1.60, and $ 1.70 levels.
Nevertheless, the Arbitrum price was rejected at the important level of $1.026, however, with $0.975 as the new psychological barrier to the bull run, any movement below it is a bear territory as bulls may need to stay on their toes. However, if a deeper correction follows here, it could be considered extremely unhealthy for ARB/USD as the critical supports are located at $0.50, $0.40, and $0.30. The 9-day MA is below the 21-day MA to confirm the bearish trend.
ARB/USD Medium-term Trend: Bearish (4H Chart)
Looking at the 4-hour chart, ARB/USD is seen on a downward move and the coin may continue to depreciate if the $0.975 support is broken. Looking at the chart, the 9-day moving average may cross below the 21-day moving average, and the Arbitrum price may continue to fall which could reach the critical support at $0.90 and below.
In other words, if the bulls can hold the current price, ARB/USD may likely cross above the moving averages to hit the potential resistance at $1.06 and above. On that note, for a bullish movement to play out, buyers may need to halt the current market movement by the market to the north as fast as possible.
Place winning Arbitrum trades with us. Get ARB here