Wall Street Memes (WSM) Price Is at $0.0003, Recovery Stays On
Estimated Reading Time: 3 minutes
Don’t invest unless you’re prepared to lose all the money you invest. This is a high-risk investment and you are unlikely to be protected if something goes wrong. Take 2 minutes to learn more

Wall Street Memes Price Prediction – November 23
As of this piece, trading activity shows WSM gradually reclaiming upward ground as buyers consistently absorbed dips near support levels. Strengthening volume on rebounds, improved stability above short-term EMAs, and reduced selling pressure have collectively encouraged a steady recovery, keeping price action firm around the $0.0003 zone.
In the WSM/USD pairing, recent trading activity shows the Wall Street Memes coin stabilizing above successive intraday support levels after rejecting deeper lows. Buyers steadily absorbed sell-side pressure near $0.00028, allowing momentum indicators to pivot upward. A mild crossover between short-term EMAs reinforced renewed confidence, helping the price reclaim $0.0003 as recovery efforts continue strengthening.
WSM/USD Market
Key Levels
Resistance levels: $0.0004, $0.00045
Support levels: $0.00025, $0.0002, $0.00015
WSM/USD – 4-hour Chart
On the medium-term chart, the WSM/USD is trading at $0.0003, keeping its recovery momentum active.
The Bollinger Bands are tightening near their lower ranges, indicating limited price expansion. At the same time, the Stochastic Oscillators are moving slightly lower in the deeply oversold zone, indicating that traders are closely watching short-term market momentum.
Can WSM/USD Sustain Its Ongoing Recovery While Holding Firmly Above Key Short-Term Market Support Levels?
WSM/USD trade’s continuation depends on buyers maintaining control above nearby support zones. As long as price reactions stay constructive and volume remains steady, the pair could extend its recovery. However, weakening momentum near resistance may slow the advance and invite consolidation.
With WSM firmly above its key intraday support levels, the coin demonstrates resilience, signaling promising recovery potential. Should buying interest persist, this could trigger incremental price gains, attracting more market participants. Continuous monitoring of support zones may reveal a structured path for sustained upward momentum, offering traders a cautiously optimistic outlook for upcoming sessions.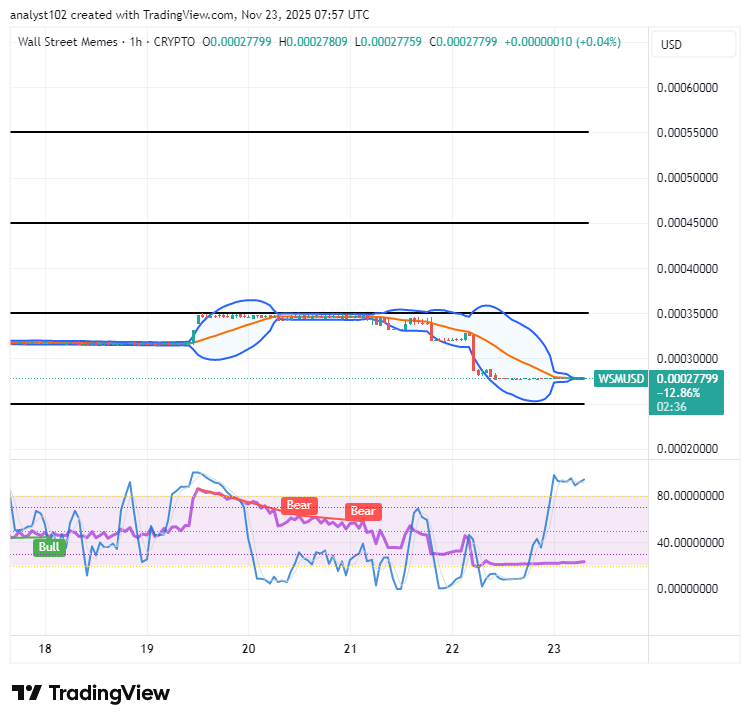
WSM/USD 1-hour chart
The WSM/USD short-term chart showcases the base trading instrument at $0.0003, leading the market’s recovery to stay on.
The Bollinger Bands stay tightly squeezed around $0.0003, indicating a strong consolidation area that could potentially lead to a significant market breakout in the near future. The Stochastic Oscillators are still moving under mild bearish pressure, showing that short-term momentum remains slightly weak but closely monitored by active traders.
Over the past 24 hours, the $WSM ecosystem and its vibrant community have faced a coordinated malicious intrusion, with attackers deliberately exploiting vulnerabilities to target our Discord hub.
Over the last 24 hours, The $WSM token and community has undergone a coordinated attack. The hackers specifically targeted our Discord community.
— Wall Street Memes (@wallstmemes) October 12, 2023
We reiterate that no one from the Wall St Memes team will ever direct message you first, or ask for any personal information – even… pic.twitter.com/VwySpXC7cz