Wall Street Memes (WSM) Market Rises, Following a Base
Estimated Reading Time: 3 minutes
Don’t invest unless you’re prepared to lose all the money you invest. This is a high-risk investment and you are unlikely to be protected if something goes wrong. Take 2 minutes to learn more

Wall Street Memes Price Prediction – October 19
After forming a solid base, the Wall Street Memes (WSM) market witnessed bullish momentum as buyers drove prices higher. Bears attempted brief pullbacks, but strong buying pressure sustained the upward movement, confirming renewed investor confidence in market strength.
Following a period of steady consolidation, Wall Street Memes (WSM) shows renewed upward momentum as buying interest builds. Despite brief sell attempts, demand remains strong; suggesting holding the asset long-term could yield solid returns as confidence builds.
WSM/USD Market
Key Levels
Resistance levels: $0.0008, $0.0009, $0.001
Support levels: $0.0005, $0.0004, $0.0003
WSM/USD – 4-hour Chart
The WSM/USD medium-term chart reveals that the crypto-economic market rises, following a solid base formation.
A strong candlestick has risen from the $0.0005 low, breaking through resistances of the $0.0006 level, signaling a possible steady buildup of momentum. The Stochastic Oscillators curve upward, confirming that buyers continue to dominate the market direction.
Is Wall Street Memes (WSM) Showing Strong Bullish Momentum As Price Breaks Through Key Resistance Levels?
The price movement of Wall Street Memes (WSM) reflects strong bullish momentum as it breaks key resistance levels. This breakout highlights renewed buying pressure and growing confidence, suggesting the potential for a sustained upward trend in the near term.
Recent market behavior around Wall Street Memes (WSM) reveals an impressive bullish revival, as price strength decisively clears crucial resistance zones and stirs renewed optimism. With momentum building and volatility leaning upward, ensuing market swings may continue favoring the moon side, opening room for extended appreciation toward higher valuation regions.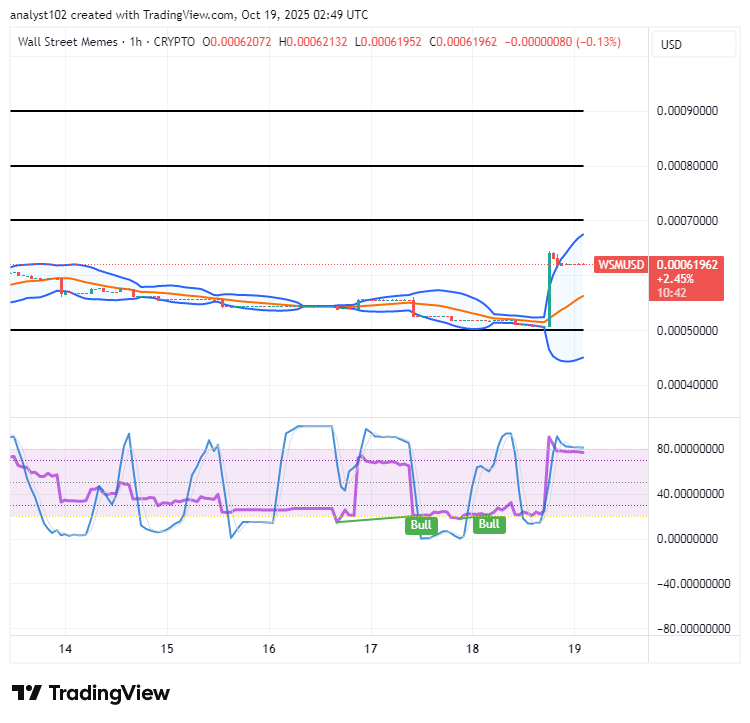
WSM/USD 1-hour chart
Business activities on the WSM/USD 1-hour chart show that the crypto market rises, following a solid base formation at $0.0005 values.
The Stochastic Oscillators remain positioned in the overbought region, signaling that bullish momentum continues to steer market activity. Meanwhile, the Bollinger Bands are expanding in tandem with the upward price movement, indicating sustained buying pressure and suggesting that the price is likely to approach the $0.0007 mark soon.
Over the last 24 hours, the $WSM token and community has undergone a coordinated cyber attack, where hackers specifically and deliberately targeted our official Discord community, disrupting member communications and attempting to compromise sensitive community data.
Over the last 24 hours, The $WSM token and community has undergone a coordinated attack. The hackers specifically targeted our Discord community.
— Wall Street Memes (@wallstmemes) October 12, 2023
We reiterate that no one from the Wall St Memes team will ever direct message you first, or ask for any personal information – even… pic.twitter.com/VwySpXC7cz