Wall Street Memes (WSM) Trade Hits $0.0003, Buyers Hold Firm
Estimated Reading Time: 3 minutes
Don’t invest unless you’re prepared to lose all the money you invest. This is a high-risk investment and you are unlikely to be protected if something goes wrong. Take 2 minutes to learn more
Wall Street Memes Price Prediction – November 22
The recent move toward the $0.0003 region reflects a market atmosphere where determination from buyers continues to play a stabilizing role. Each time sellers tried to push the price lower, buyers stepped in to absorb the pressure, helping WSM stay stable around this key level. That repeated resilience has given traders a sense that underlying interest remains active, even as broader volatility thins out.
As WSM market continues consolidating around the $0.0003 level, committed buyers have shown little willingness to abandon their positions, reinforcing confidence in the token’s near-term structure. Their persistent presence has created a cushioning effect beneath price action, reducing the risk of deeper dips. This steady build-up indicates that traders are closely watching for any momentum change that might create an opening for a possible upward move.
WSM/USD Market
Key Levels
Resistance levels: $0.0004, $0.00045, $0.0005
Support levels: $0.0003, $0.00025, $0.0002
WSM/USD – 4-hour Chart
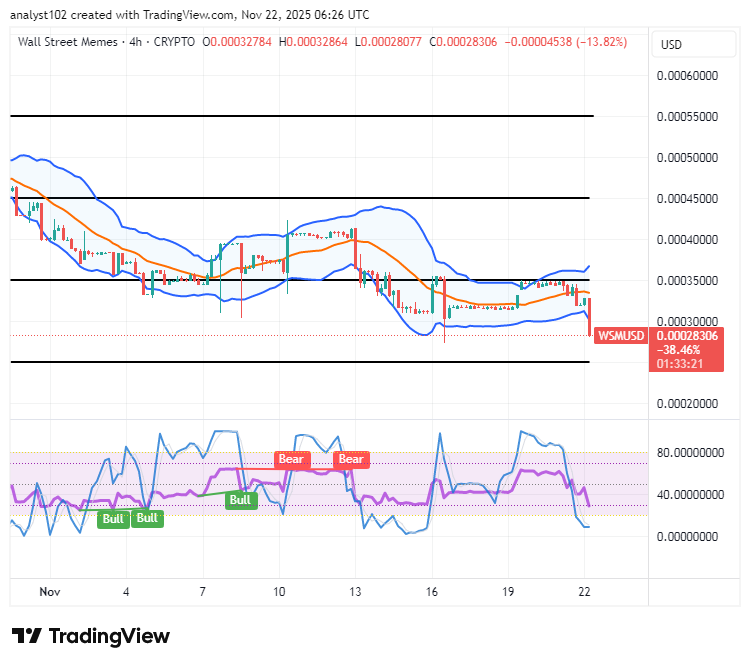
On the medium-term chart, the WSM/USD trade showcases price actions hitting $0.0003 downside, as buyers hold firm.
As of this piece, the Stochastic Oscillators are currently seen in a slight southbound-swerving motion around the deeply oversold region, suggesting that short-term momentum remains under careful observation by traders. The Bollinger Bands are being consistently tapped along their upper section, clearly signaling that upward market pressure is steadily building with greater persistence and showing signs of potential sustained bullish activity.
Can WSM Sustain Stability Around the $0.0003 Mark as Committed Buyers Continue Holding Their Positions?
WSM’s ability to hold near the $0.0003 region reflects steady buyer commitment despite mild selling pressures. If these supportive inflows continue and volatility stays low, the market is likely to remain stable while traders wait for clearer signals.
WSM’s price hovering around $0.0003 highlights consistent buyer support absorbing minor sell-offs. This sustained demand reinforces market stability, preventing deeper pullbacks, while cautious participants monitor momentum closely, suggesting that the token may remain steady until a clearer trend emerges.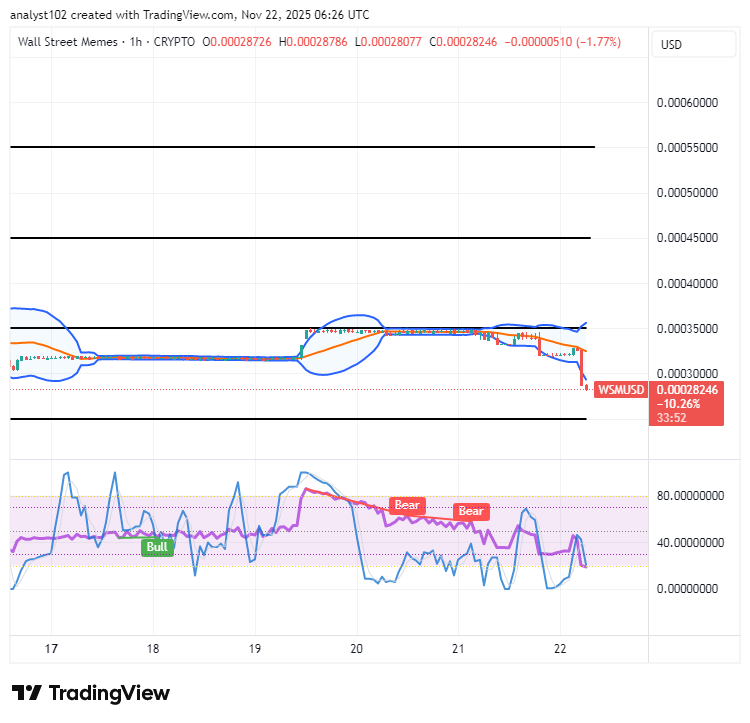
WSM/USD 1-hour chart
The WSM/USD short-term chart demonstrates the base crypto economy hits $0.0003, leading to making buyers hold on steady.
The Stochastic Oscillators are still moving under mild bearish pressure. The Bollinger Bands stay tightly squeezed around $0.0003, indicating a strong consolidation area that could lead to a clear market breakout soon.
$WSM / $USDT is officially available for trading on Bybit Perpetuals.
Start trading here: [https://i.bybit.com/1Wab4K3z](https://i.bybit.com/1Wab4K3z)
Have a project you’d like to see listed? Submit your suggestions here:
$WSM community, we saw your Tweets! 👏$WSM / $USDT is now tradeable on #Bybit Perpetuals.
— Bybit (@Bybit_Official) October 13, 2023
Trade here: https://t.co/le4XyVyXaZ
Also want your project listed? Share your suggestions here:https://t.co/W7EWJVVNV5 https://t.co/XgXoL7g0rF