Solana (SOL/USD) Price Is Still Undecided Around $20
Estimated Reading Time: 3 minutes
Don’t invest unless you’re prepared to lose all the money you invest. This is a high-risk investment and you are unlikely to be protected if something goes wrong. Take 2 minutes to learn more
Solana Price Prediction – March 24
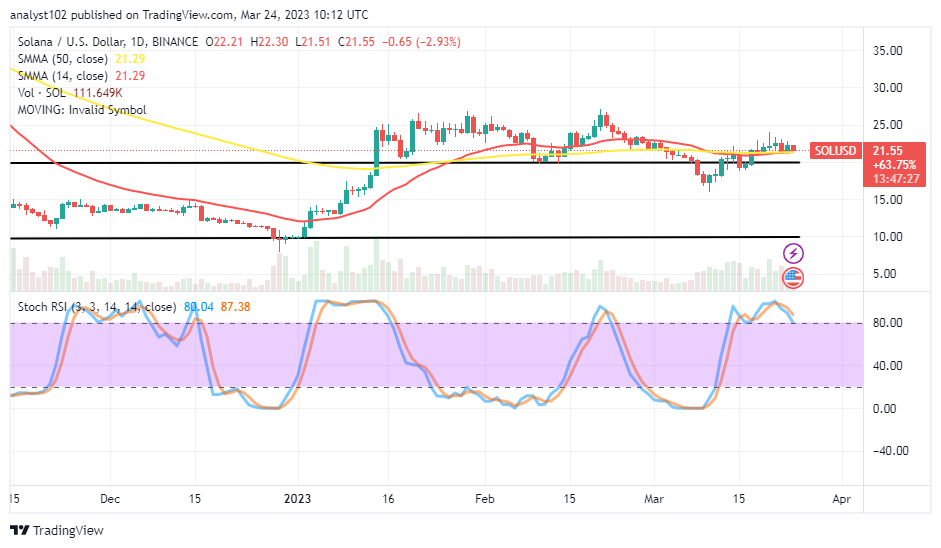
There have been prolonged low-active motions in the SOL/USD market as the crypto-economic price remains undecided around the $20 trading line. As it is, buyers hold a glimpse of the rare probability of sustaining through pushes outside the high and the low-value lines of $22.30 and $21.51, as presently indicated. Price is trading at 2.93% negatives to affirm the possibility of witnessing a decline in the subsequent operations.
SOL/USD Market
Key Levels:
Resistance levels: $25, $27.50, $30
Support levels: $17.50, $15, $12.50
SOL/USD – Daily Chart
The SOL/USD daily chart reveals that the crypto-economic price is still undecided around the long projected upper range value line at $20. The 14-day SMA trend line has continued to clog alongside the 50-day SMA trend line toward the eastward direction as they maintain the same $2129 point. The Stochastic Oscillators are in the overbought region, trying to cross southbound at 87.38 and 80.04 levels to signify that a selling move is ongoing.
Will the SOL/USD market lose positions or continue to linger below the $25 resistance line?
It would be technically ideal to go by the Stochastic Oscillators to observe the trend downward from an overbought condition below or around the $25 resistance as the SOL/USD price keeps undecided around the $20 line. Psychologically speaking, the Stochastic Oscillators’ reading posture detects when to follow a trend down from an overbought state below or around the $25 resistance as the SOL/USD price remains choppy near the $20 line.
On the downside of the technical analysis, the SOL/USD market bears will have to firmly establish their presence underneath the $25 resistance line until another round of oversold positioning has to feature. If sellers intend to carry out shorting orders at all costs, they need to look out for active motions to back the moves to the downside before doing so.
SOL/BTC Price Analysis
In comparison, Solana is debasing almost maximally in the outlook of losing every stance against Bitcoin below the trend lines of the SMAs. The 14-day SMA indicator is trending over the formation of trading candlesticks underneath the 50-day SMA indicator. The Stochastic Oscillators are around 20l, trying to cross back southbound at 18.73 and 11.21 levels. A line of more lows can still surface toward the lower horizontal line drawn. The swing high would emerge forcefully if any movement were to occur toward breaking past the smaller SMA.
Note: Cryptosignals.org is not a financial advisor. Do your research before investing your funds in any financial asset or presented product or event. We are not responsible for your investing results.
You can purchase Lucky Block here. Buy LBLOCK


