Polygon (MATIC/USD) Market Sits at $0.50, Mustering Catalysts
Estimated Reading Time: 3 minutes
Don’t invest unless you’re prepared to lose all the money you invest. This is a high-risk investment and you are unlikely to be protected if something goes wrong. Take 2 minutes to learn more
Polygon Price Prediction – September 24
A recession trade motion has taken place in the Polygon market against the US dollar, running into about three days to presently produce a crypto-economic market that sits at $0.50, mustering catalysts.
It is possible that vigorous movements in the ensuing trading days will face additional tight recessive bargaining modes with the point of issue in focus, as has been seen on the indications list. Following the tendency of that projection to come true, restoring stances has been the way to recover a rise. If that presumption is accurate, no additional pushes should be maintained below the point of $0.50.
MATIC/USD Market
Key Levels:
Resistance levels: $0.60, $0.65, $0.70
Support levels: $0.45, $0.40, $0.35
MATIC/USD – Daily Chart
The MATIC/USD daily chart reveals that the crypto-economic markets are at $0.50, mustering catalysts as the trend lines of the moving averages.
The 50-day SMA trend line is above the 14-day SMA trend line, showcasing $0.642 and $0.541 points as the major contending barriers. The stochastic oscillators have slantingly positioned southbound from the overbought region to place between 66.20 and 63.34, denoting that a paused dealing session would be in the subsequent days.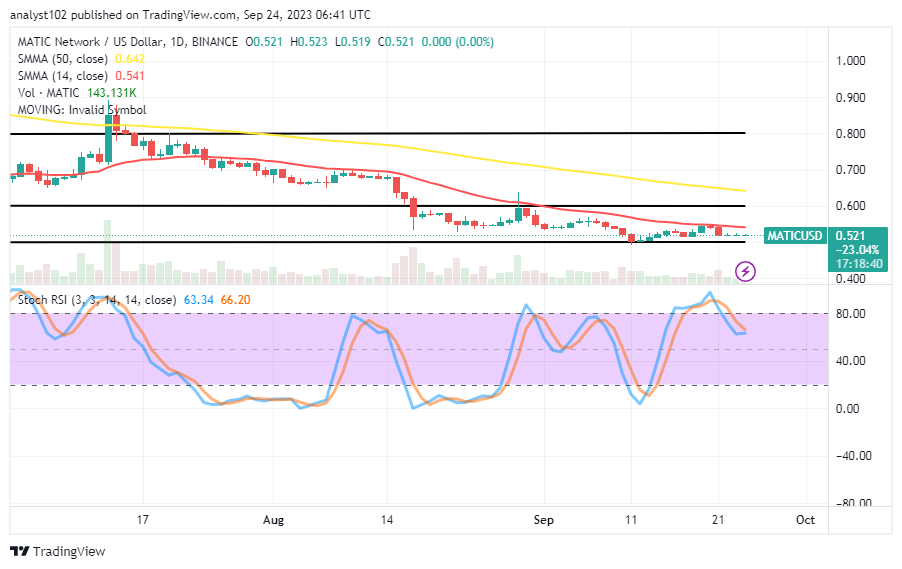
How does the bargaining outlook portend in the MATIC/USD market concerning the 14-day SMA?
The transaction between Polygon and the US Dollar in relation to the 14-day SMA shows that the degree of action responsiveness has been between the indicator and the line of $0.50, given that the crypto trade sits at the value line, mustering catalysts.
Buyers are likely to regularly rebuild their postures from beneath the zones that have been deepening in the meantime. Investors are to maintain their mindset of establishing positions for holding on a long-term basis, regardless of the likelihood of seeing more lows beyond the $0.50 area.
A weak valuation spring in the cryptocurrency market that intentionally touches a resistance area near the trend line of the smaller SMA will offer bears the opportunity to move backward in an effort to approach the $0.50 line for a breakdown. But given that the choice was taken promptly, it would be dangerous to comply with shorting orders without immediately executing a stop-loss order.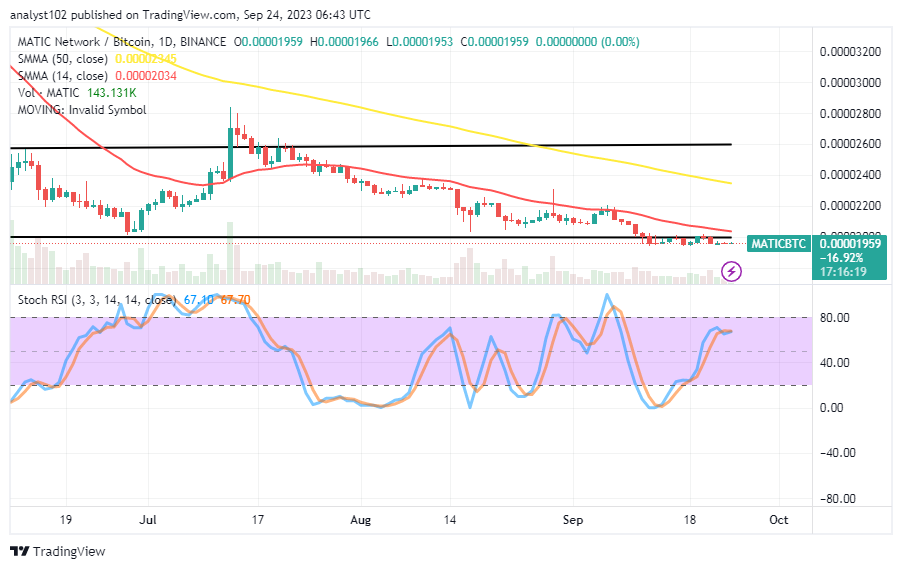
MATIC/BTC Price Analysis
In comparison, the Polygon market sits at a lower-trading spot against Bitcoin below the trend lines of the moving averages, mustering catalysts.
Underneath the 50-day SMA indication is the 14-day SMA indicator. Making points at the topside of the smaller candlesticks that had been prominent for roughly two weeks, the lower horizontal line was drawn. The stochastic oscillators have crossed over to the north from an oversold area to position 67.70 to 67.10, suggesting that the base cryptocurrency may still need some time to debase before recovering against its quoting crypto economy.
Note: Cryptosignals.org is not a financial advisor. Do your research before investing your funds in any financial asset or presented product or event. We are not responsible for your investing results.
You can purchase Lucky Block here. Buy LBLOCK