Litecoin (LTC/USD) Price Has Shot Up, Relaxing at $75
Estimated Reading Time: 3 minutes
Don’t invest unless you’re prepared to lose all the money you invest. This is a high-risk investment and you are unlikely to be protected if something goes wrong. Take 2 minutes to learn more
Litecoin Price Prediction – February 27
There has been some positive dings that most crypto signal that have been projected to run into a bullish trend are going to ne materializing, given that the LTC/USD trade presently shoots up, relaxing the momentum around the line of $75.
It would be crucial for those taking long positions to keep their buying path above the middle Bollinger Band’s trend line, which is now at roughly $70. A systemic downward motion against the point may probably result into a chain of lower lows in the subsequent transactions.
LTC/USD Market
Key Levels:
Resistance levels: $75, $80, $85
Support levels:$65, $60, $55
LTC/USD – Daily Chart
The LTC/USD daily chart showcases the crypto-economic market shoots up, relaxing around the point of $75.
The Bollinger Band trend lines are getting set to place to the north side.The upper Bollinger Band indicator will have to succumb to buying forces. At the moment of this piece, the stochastic oscillators are in the mood of trying to cross their lines to the north closely around 80. , 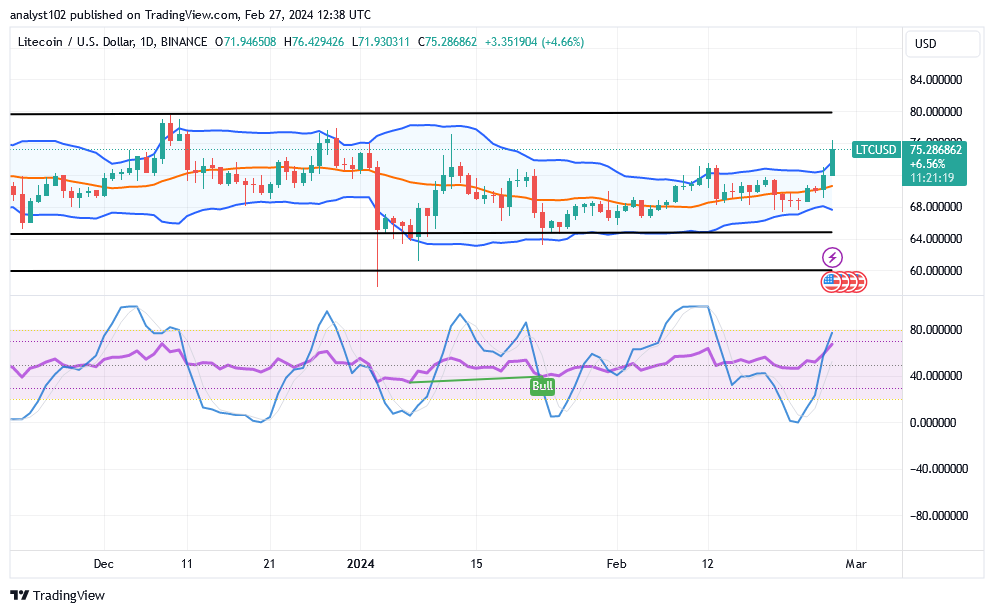
Which line or area is going to be a more difficult resistance to breach in the near future as the LTC/USD market soars?
If the present uprising forces in the market activities of LTC/USD would have to continue higher than its present trade zone, the resistance line at $80 seems to be tougher spot to push further, as the price shoots up, relaxing the pace around the point of $75.
Long-position placers that might have placed an order around $68 trading spot ar encouraged to apply a breakeven position order to protect their entry against any possible unprecedented aggressive reversal motion. Execution of any related buying approach at this time should be in the manner of long-term investment order. . To put it another way, it would be reasonable for investors to continue making moves even if they involved taking on long bets.
Now that a strong move to the upside has been made, short-position placers may begin to watch out for line rejections on the price bfore launching an order. The market lines between $75 and $80 will be crucial in the interim for figuring out whether or not a secant shorting position would turn a profit.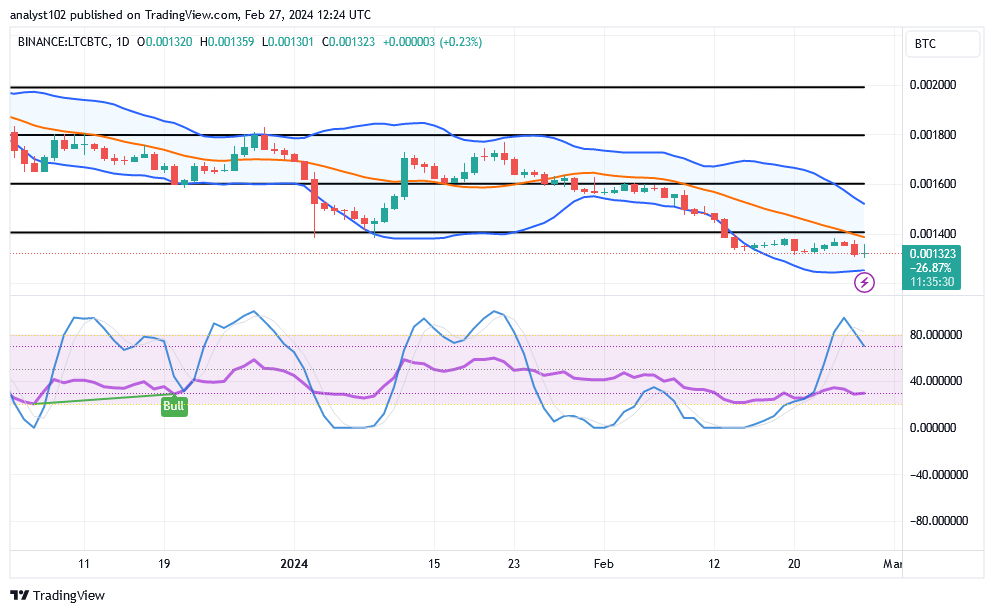
LTC/BTC Price Analysis
In contrast, the Litecoin market has been between the spots of the upper and lower Bollinger Bands against Bitcoin, as the price is relaxing in them.
The trend lines of the Bollinger Band are in the south direction. In the overbought region, the stochastic oscillators’ blue component has crossed to the south. The many signs have show that traders should not linger too long on any barish-oriented entry because the subsequent rising pace will usually be enormous very quickly.
Note: Cryptosignals.org is not a financial advisor. Do your research before investing your funds in any financial asset or presented product or event. We are not responsible for your investing results.
You can purchase Lucky Block here. Buy LBLOCK