Solana (SOL) Price Prediction: SOL/USDT Moderate Downward Retracement Hits a Break
Estimated Reading Time: 2 minutes
Don’t invest unless you’re prepared to lose all the money you invest. This is a high-risk investment and you are unlikely to be protected if something goes wrong. Take 2 minutes to learn more

Date: December 5, 2025
The Solana market has rebounded from its low around the $130 mark. However, the market still hasn’t displayed its best performance lately and currently stands at a crossroads. Let’s dive deeper below for more insight.
Long-Term Trend—Bullish (Daily Chart)
Key Price Levels:
Resistance: $140, $145, $150
Support: $135, $125, $120
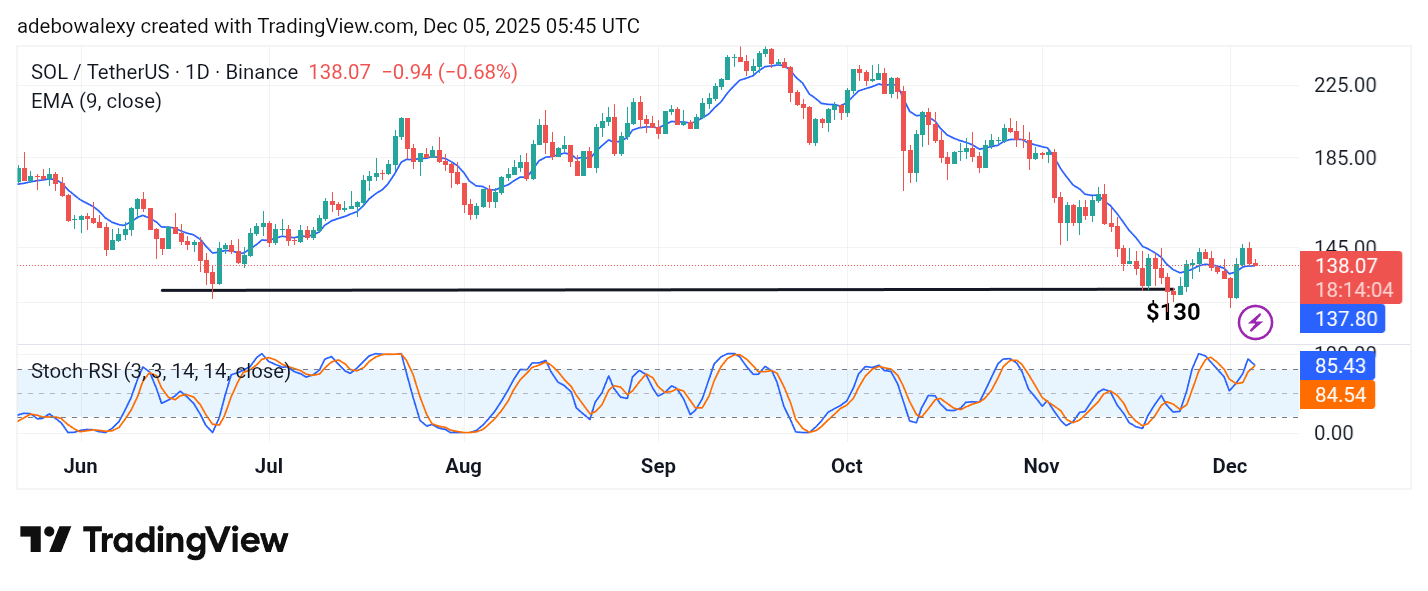
Price action has descended to test the support formed by the 9-day Exponential Moving Average. The latest price candle on the Solana daily chart is red and sits just above the 9-day EMA curve. At the same time, the Stochastic Relative Strength Index (SRSI) indicator lines are at a crossover above the 80 level.
Solana (SOL) Price Prediction: SOL/USDT Stands at a Crossroad
The latest price candle on the Solana daily chart is red, and its position just above the 9-day EMA curve is notable.
Meanwhile, the SRSI indicator lines are also at a crossover, pointing to a key moment in the market. If price action falls below the 9-day EMA, traders may see the market slip lower. Conversely, if the market rebounds off this technical level, SOL may push toward higher price zones.
Solana (SOL) Price Prediction: SOL/USDT Bearish Movement Grows Weak (4-Hour Chart)
On the 4-hour price chart, price activity has crossed below the 9-day EMA curve. However, recent price candles suggest weakening downward pressure, as they show reduced bearish movement.
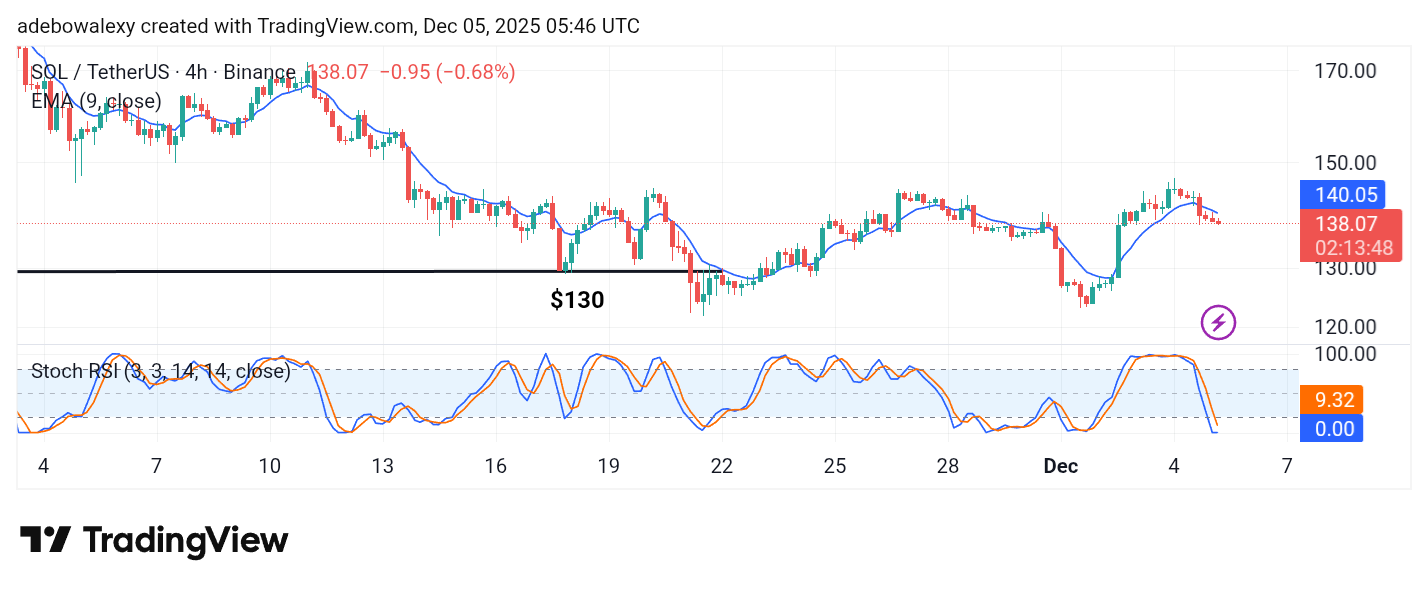
The SRSI indicator lines on this chart have hit the 0.00 level of the oversold region via its lead line. This indicates that the market may experience an upward bounce soon, despite the possibility of a brief dip toward the $135 support level.