Solana (SOL) Price Prediction: SOL/USDT Recovers Trading Ground Above the $140 Threshold
Estimated Reading Time: 2 minutes
Don’t invest unless you’re prepared to lose all the money you invest. This is a high-risk investment and you are unlikely to be protected if something goes wrong. Take 2 minutes to learn more

Date: November 27, 2025
The Solana market has continued to post modest upward movement in its price action. This began as price activity started making its way steadily upward along with the Bitcoin market. Although there are signs of bearish pullbacks, this market still has the technical grounds to keep rising in the meantime.
Long-Term Trend — Bullish (Daily Chart)
Key Price Levels:
Resistance: $145, $150, $155
Support: $140, $135, $125
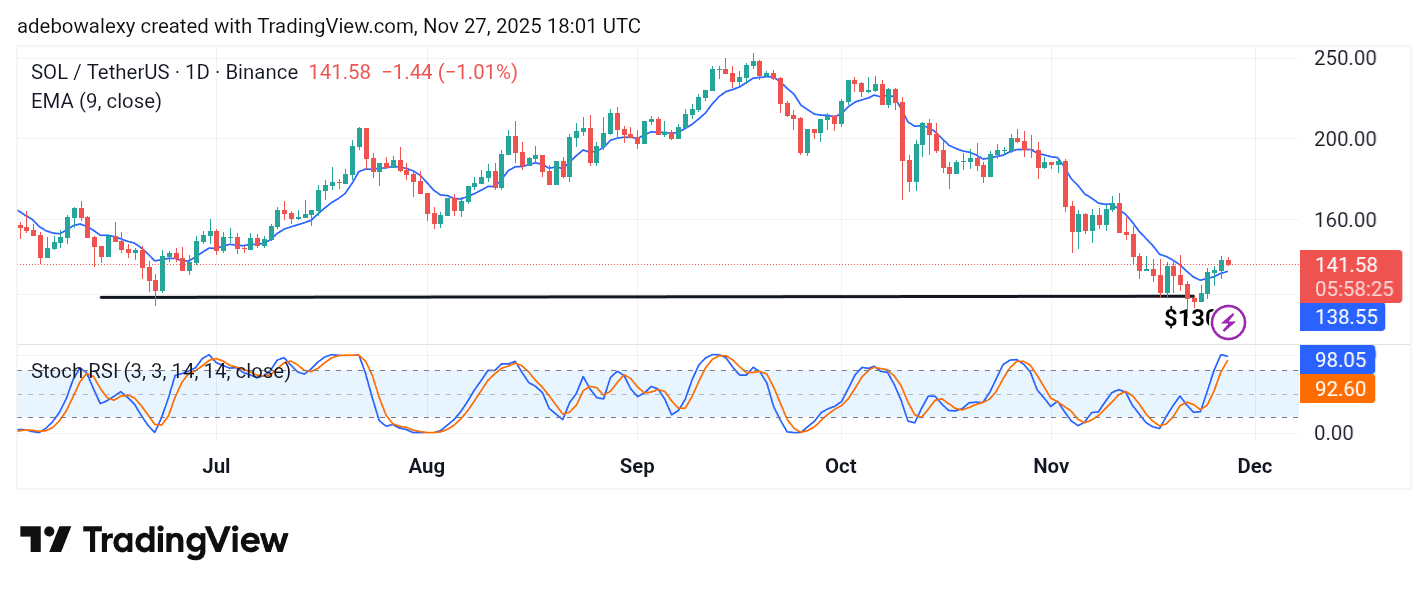
Price candles in the Solana market have started appearing above the 9-day Exponential Moving Average (EMA) curve. The ongoing session, however, is represented by a red price candle positioned above the 9-day EMA. Meanwhile, the lines of the Stochastic Relative Strength Index (SRSI) indicator are already in the overbought region. Although the lead line of the indicator is deflecting sideways there, it shows lingering bullish sentiment.
Solana (SOL) Price Prediction: SOL/USDT Market Shows a Delicate Recovery
The last price candle on the Solana chart appears red, but as noted earlier, price action remains above the 9-day EMA line. On the daily chart, price activity in the ongoing session still stands at a distance above the 9-day EMA curve.
Furthermore, the deflection on the SRSI indicator lines can be seen edging closer toward a downward crossover. However, with price action still positioned above the 9-day EMA line, the market may rebound off the support at the 9-day EMA if price tests that region.
Solana (SOL) Price Prediction: SOL/USDT Hits the 9-Day EMA (4-Hour Chart)
While price action hovers above the 9-day EMA curve on the daily chart, the 4-hour chart presents a slightly different view. Here, price action has descended to test the 9-day EMA curve from above.
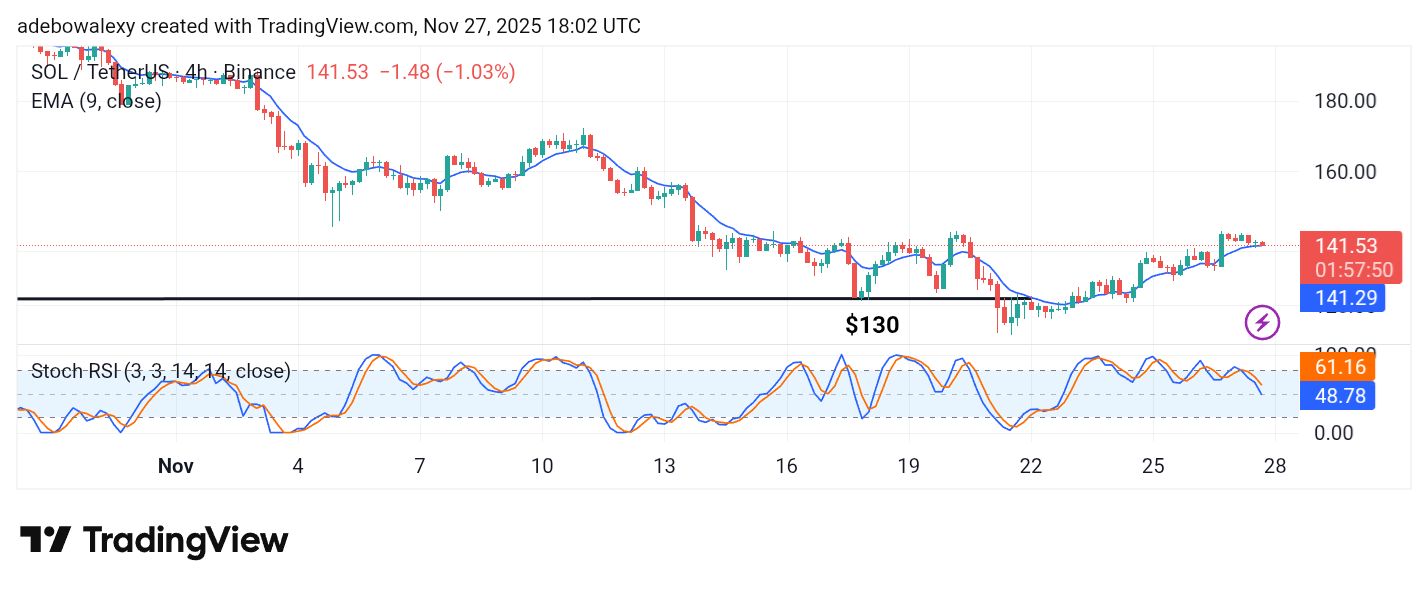
And although price movement has only shifted by a small margin, the SRSI indicator lines have fallen more steeply through the 50 level via its lead line. Consequently, this suggests that bearish sentiment is relatively weak and that upside movement still has a chance to win out. As such, price action may push toward the $145 price level.