Litecoin Price Prediction: LTC/USDT Retraces Southwards
Estimated Reading Time: 3 minutes
Don’t invest unless you’re prepared to lose all the money you invest. This is a high-risk investment and you are unlikely to be protected if something goes wrong. Take 2 minutes to learn more

Litecoin Price Prediction (January 7):
The Litecoin market has resumed trading above the $110 price level. However, since the previous session, the market has been retracing downwards. Nevertheless, price action remains above important technical marks.
LTC/USDT Long-Term Trend: Bullish (Daily Chart)
Key Price Levels:
Resistance: $115.00, $120.00, $125.00
Support: $105.00, $100.00, $95.00
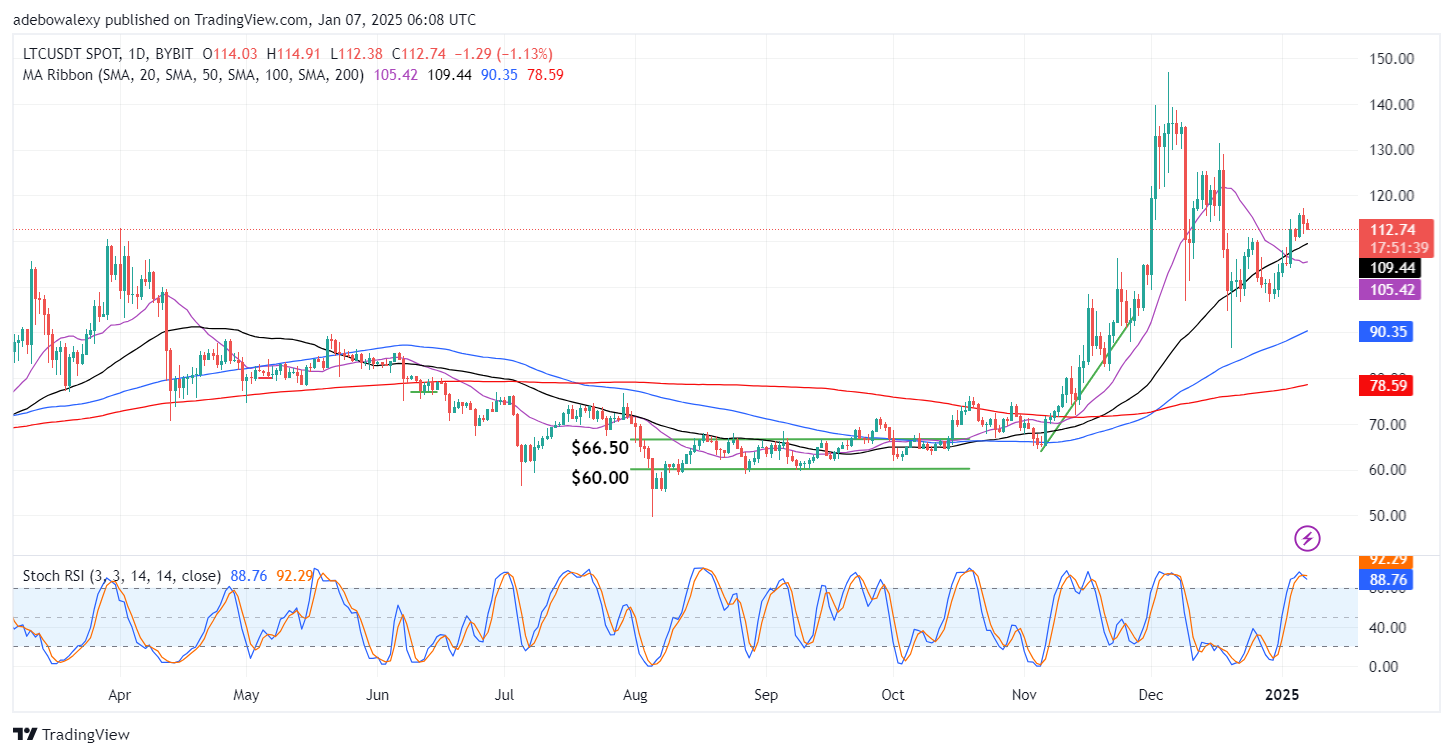
The last two price candles on the chart are bearish. Nevertheless, the price remains above the opening price of the past two trading sessions. In addition, the Moving Average (MA) has delivered a death cross below the recent price action. This coincides with the downward crossover of the Stochastic Relative Strength Index (RSI) lines in the overbought region. The Stochastic RSI indicator lines now have a slight downward bias following the crossover in the overbought region of the indicator.
Litecoin Price Prediction: LTC/USDT Appears Up Against Strong Headwind
Looking at the price movement pattern in Litecoin’s daily chart, it can be seen that price action hinted at a bullish breakout earlier. This resulted in price action breaking out of the technical resistance at the $110 price mark. However, afterward, the market encountered headwinds around the $115 price level.
The upside effect of the delivered death cross below price action seems to have been exhausted. Likewise, the bearish crossover on the Stochastic RSI indicates that downward forces are likely to drive the market in the meantime. However, with price action still above the $110 baseline and above all the MA lines, traders can still anticipate an upward rebound off those marks.
Litecoin Price Prediction: LTC/USDT Lands on a Critical Support (4-Hour Chart)
In the Litecoin 4-hour chart, price action has been moving very slowly at intervals. Here, since the past two sessions, price action has been bearish until the current session. The last price candle on the chart now sits just above the 200-day MA line while already placing the price of the token below the 20-day MA line. Meanwhile, the Stochastic RSI lines have moved very deep into the oversold region. The lead line is already touching the 0 level of the indicator.
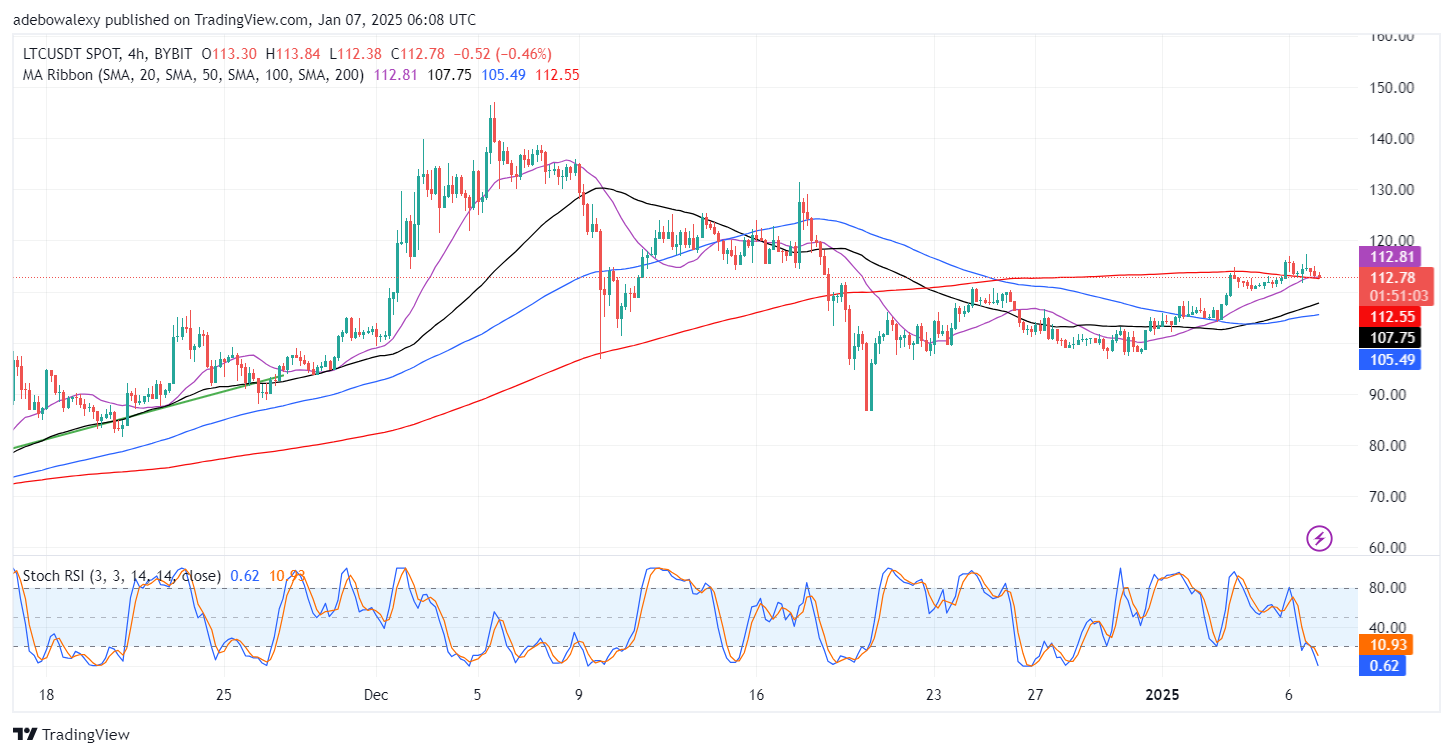
From indications arising from the LTC 4-hour market, it can be seen that price action has the potential to rebound soon. The movement of the Stochastic RSI lines has been overly hyperactive, falling too deeply into the oversold region of the indicator, given the magnitude of price movement. Meanwhile, price action can be seen standing just above the 200-day MA curve. Therefore, traders can anticipate an upward rebound off the 200-day MA or the $110 support level, towards the $120 threshold.