Dogecoin Price Prediction: DOGE/USDT Is Regaining Liveliness
Estimated Reading Time: 3 minutes
Don’t invest unless you’re prepared to lose all the money you invest. This is a high-risk investment and you are unlikely to be protected if something goes wrong. Take 2 minutes to learn more

Dogecoin Price Prediction (January 6):
The Dogecoin token is now bursting into vibrant colors. The token has just broken through the $0.3000 resistance. This is a price level below which price action has consolidated for more than two weeks. Currently, the market now trades above important technical landmarks.
DOGE/USDT Long-Term Trend: Bullish (Daily Chart)
Key Price Levels:
Resistance: $0.4000, $0.4500, $0.5000
Support: $0.3500, $0.3000, $0.2500
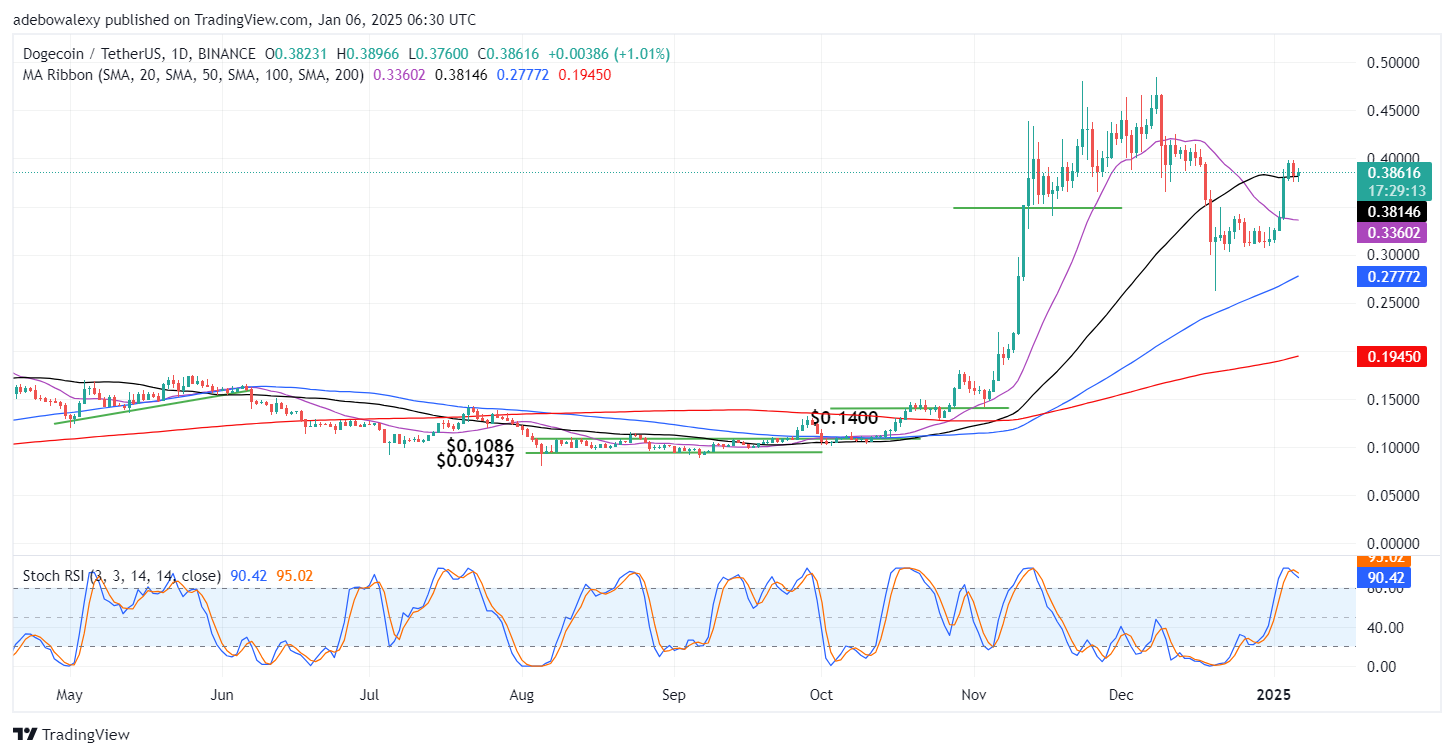
The ongoing session in the Dogecoin stands just above all the Moving Average (MA) lines. Also, the mentioned price candle appears green while sitting just atop the 50-day MA line. More recently, the price candle seems confined between the $0.4000 price level and the 50-day MA line. At the same time, the Stochastic Relative Strength Index (RSI) lines are still in the overbought region of the indicator. However, the mentioned indicator lines can be seen falling slightly downward following a crossover there.
Dogecoin Price Prediction: DOGE/USDT Maintaining an Elevated Support
Price action in the Dogecoin daily market has moved on to a higher Support level. As can be seen, price action in the market has been above the 50-day MA line. As a result, price action has been oscillating within the narrow range formed by the 50-day MA line and the $0.4000 price level. The mentioned line is the most elevated line of the MA lines.
Meanwhile, the Stochastic RSI lines are still in the overbought region. Also, the ensuing lines of the indicator are falling slightly downward towards the 80 mark of the indicator. Nevertheless, the last price candle on this chart suggests that the market may have found strong support at the 50-day MA line.
Dogecoin Price Prediction: DOGE/USDT Seems Prepared to Retest the $0.4000 Mark (4-Hour Chart)
Price activity in the Dogecoin 4-hour market remains above all the MA lines. However, the appearing price candle has a small body and, as such, portrays that price forces are contending against each other. Also, the 20- and 200-day MA lines have delivered a crossover recently below price actions. Simultaneously, the Stochastic RSI indicator lines are now in the oversold region but have performed a bullish crossover there.
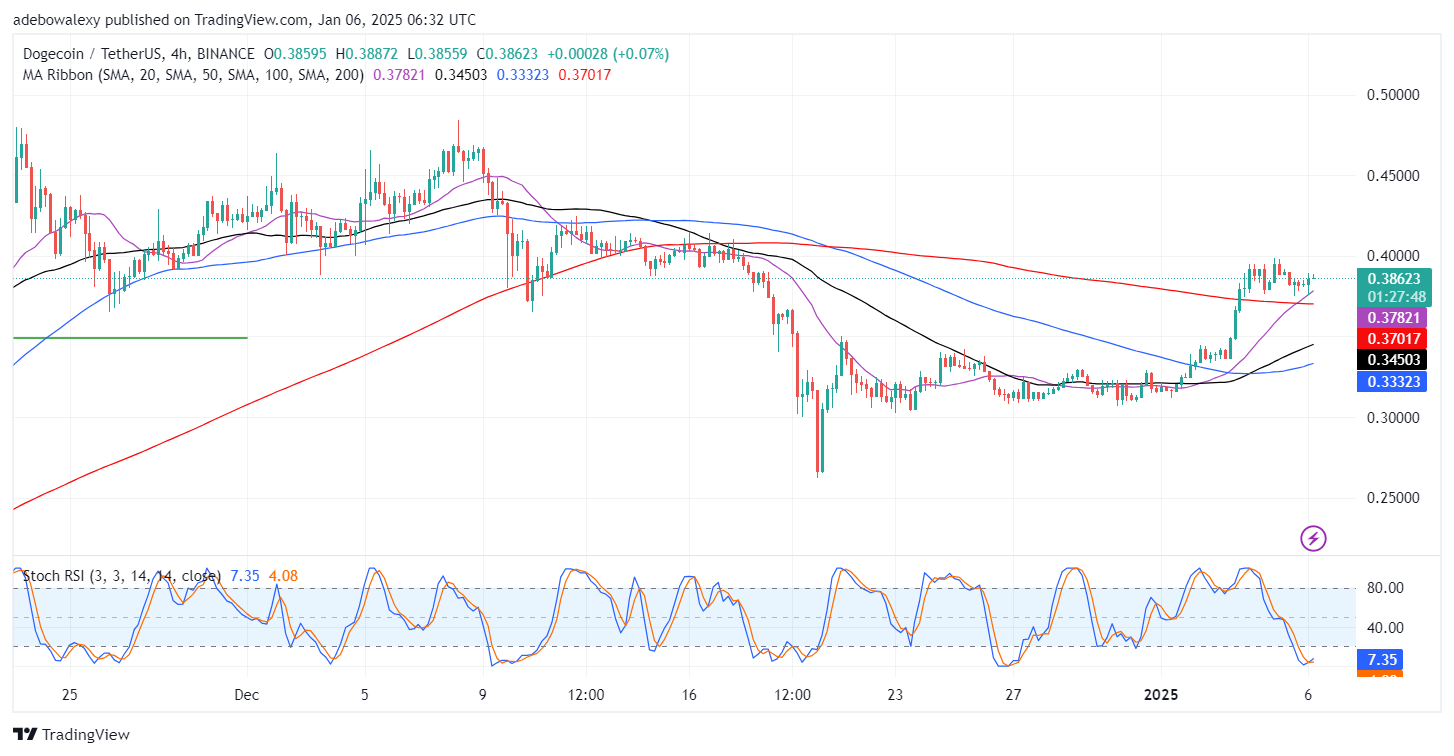
Summing up indications from technical indicators as well as price movements, it could be deduced that upside forces have a fair chance of approaching the $0.4000 price level. The position of the lines of the RSI lines suggests that upside forces may have enough room to cause considerable price increases in subsequent sessions. Therefore, traders can aim at the $0.4200 mark in this market.